**Greek Olive Oil Imports Rise Amid EU Supply Chain Disruptions**
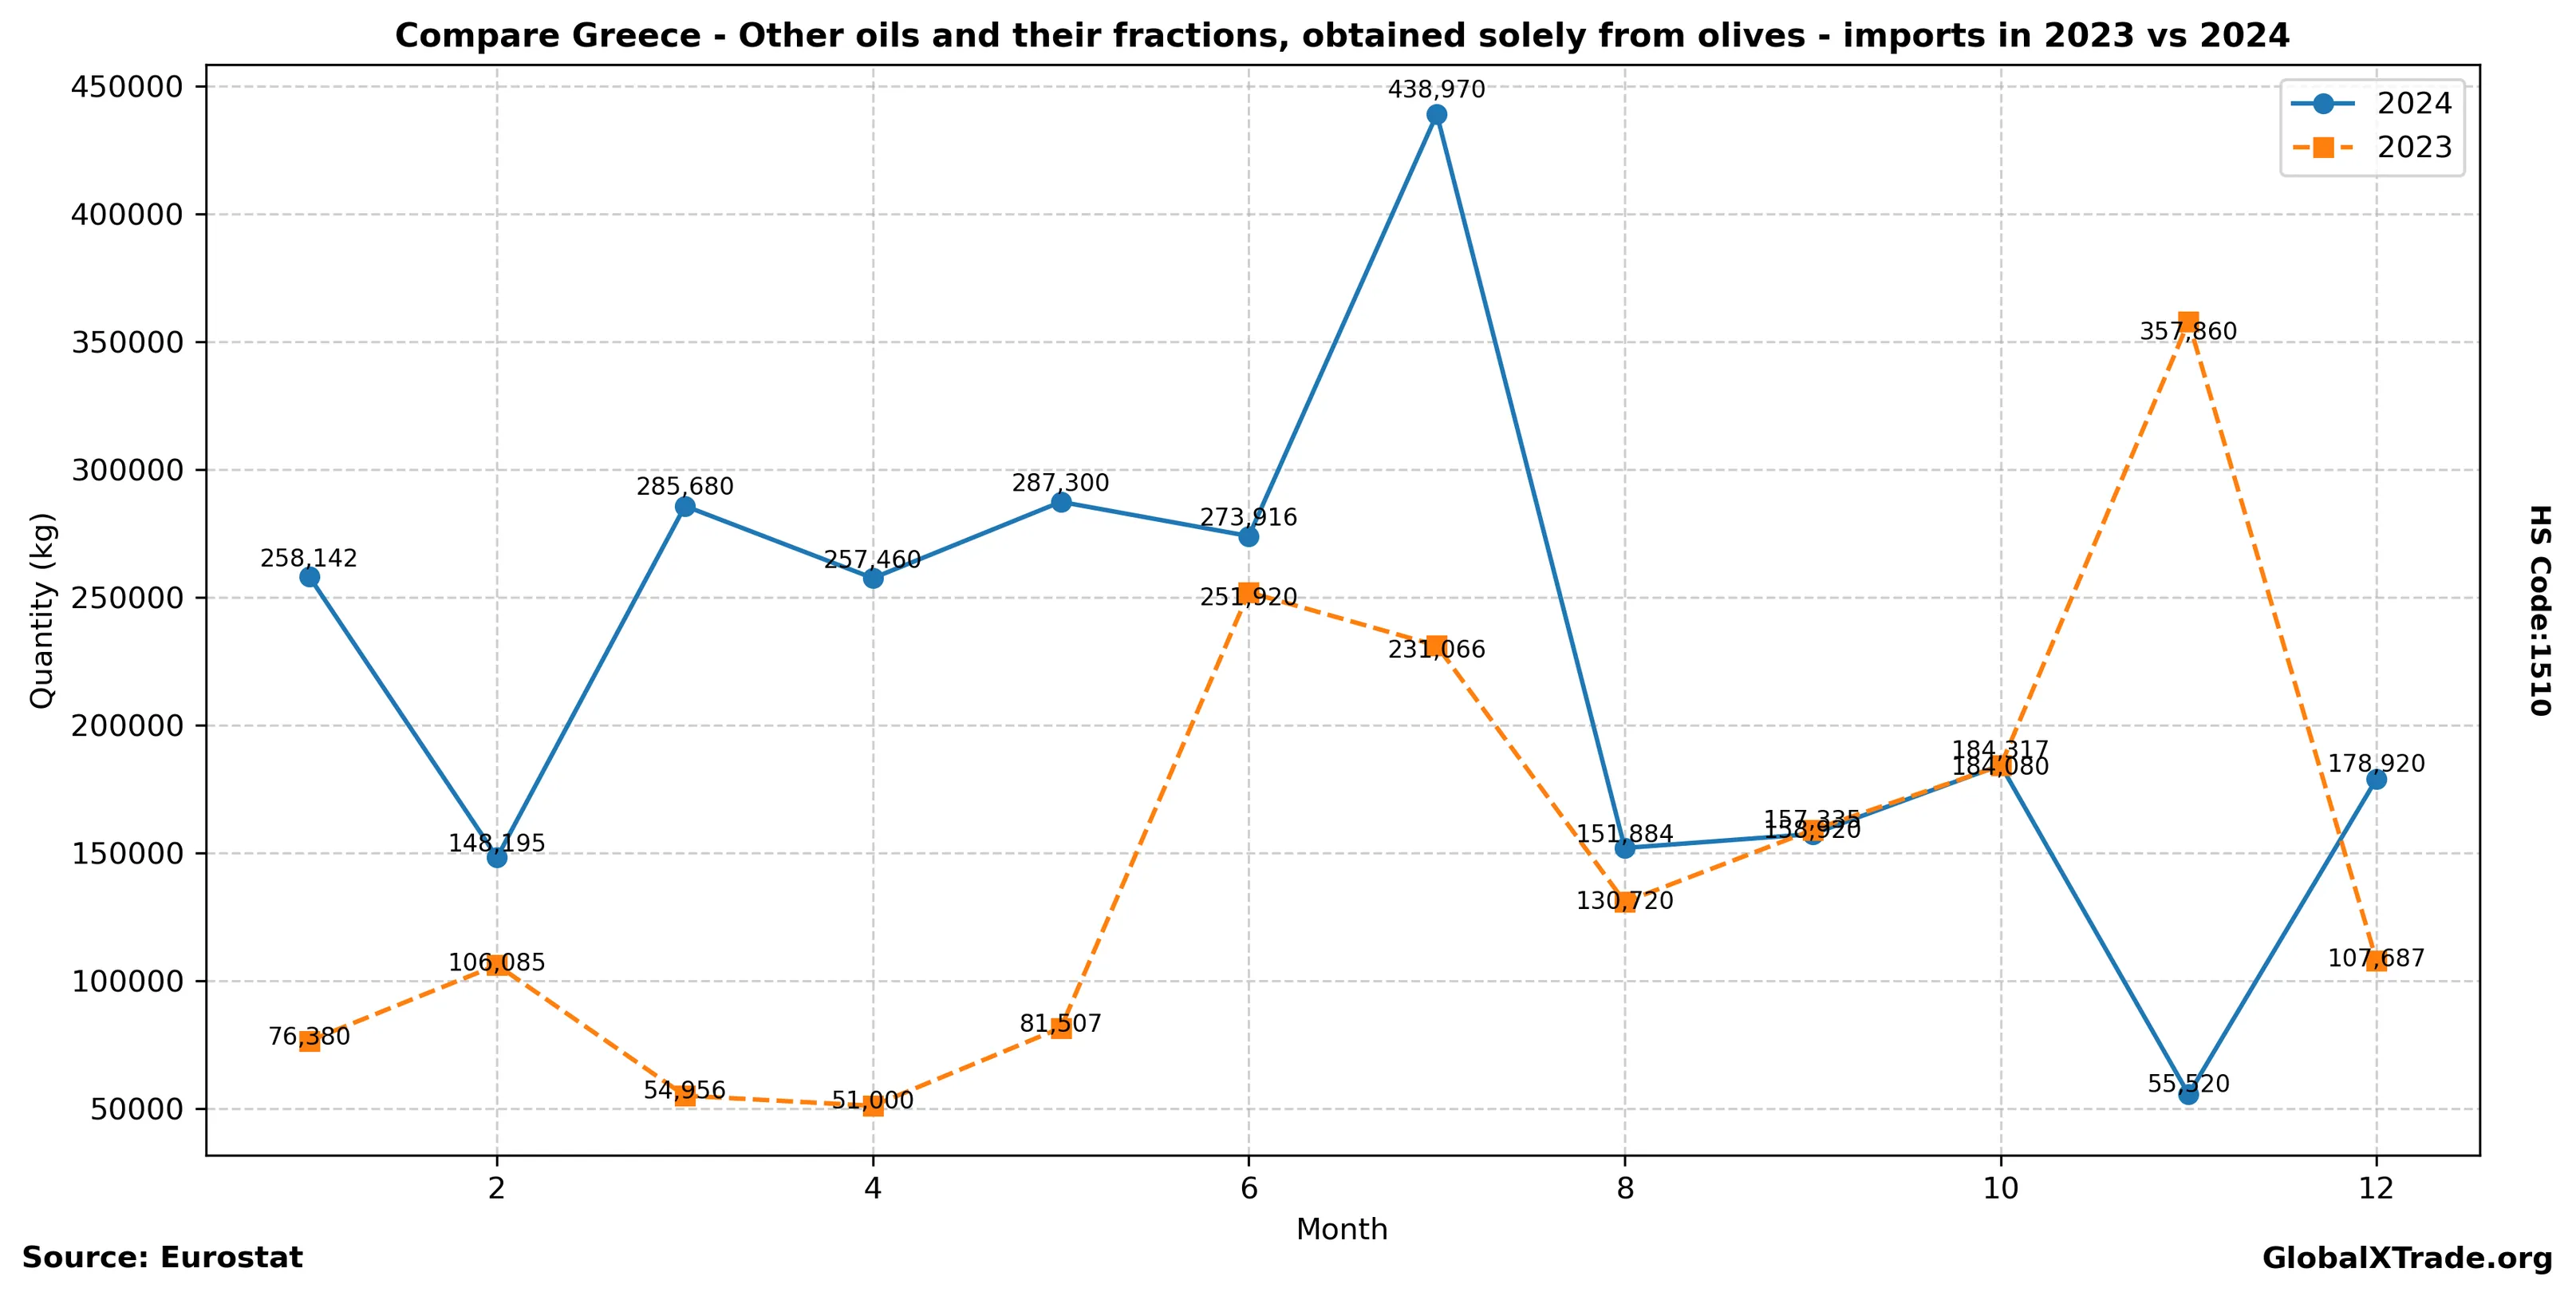
**Greece’s olive oil imports surge in June as domestic production falters**
• Greek olive oil imports increased by 12% in June compared to the same period last year.
• The rise in imports is attributed to supply chain disruptions within the European Union, impacting domestic production in Greece.
• Prices for extra virgin olive oil rose by 8% in June due to strong demand and reduced supply.
Greek olive oil imports have seen a notable increase in recent months, driven by EU-wide supply chain issues affecting local producers. Domestic production in Greece has been impacted, with many farmers struggling to meet export commitments amid weather-related crop damage and logistical challenges. As a result, Greek importers are seeking alternative sources to meet demand, pushing up prices for extra virgin olive oil.
Yearly Import Summary
| year | total_quantity_kg | total_value_eur |
|---|---|---|
| 2020 | 1,271,556 | 1,366,974 |
| 2021 | 2,873,572 | 4,606,524 |
| 2022 | 2,225,970 | 4,813,582 |
| 2023 | 1,792,181 | 5,208,750 |
| 2024 | 2,677,639 | 10,085,208 |
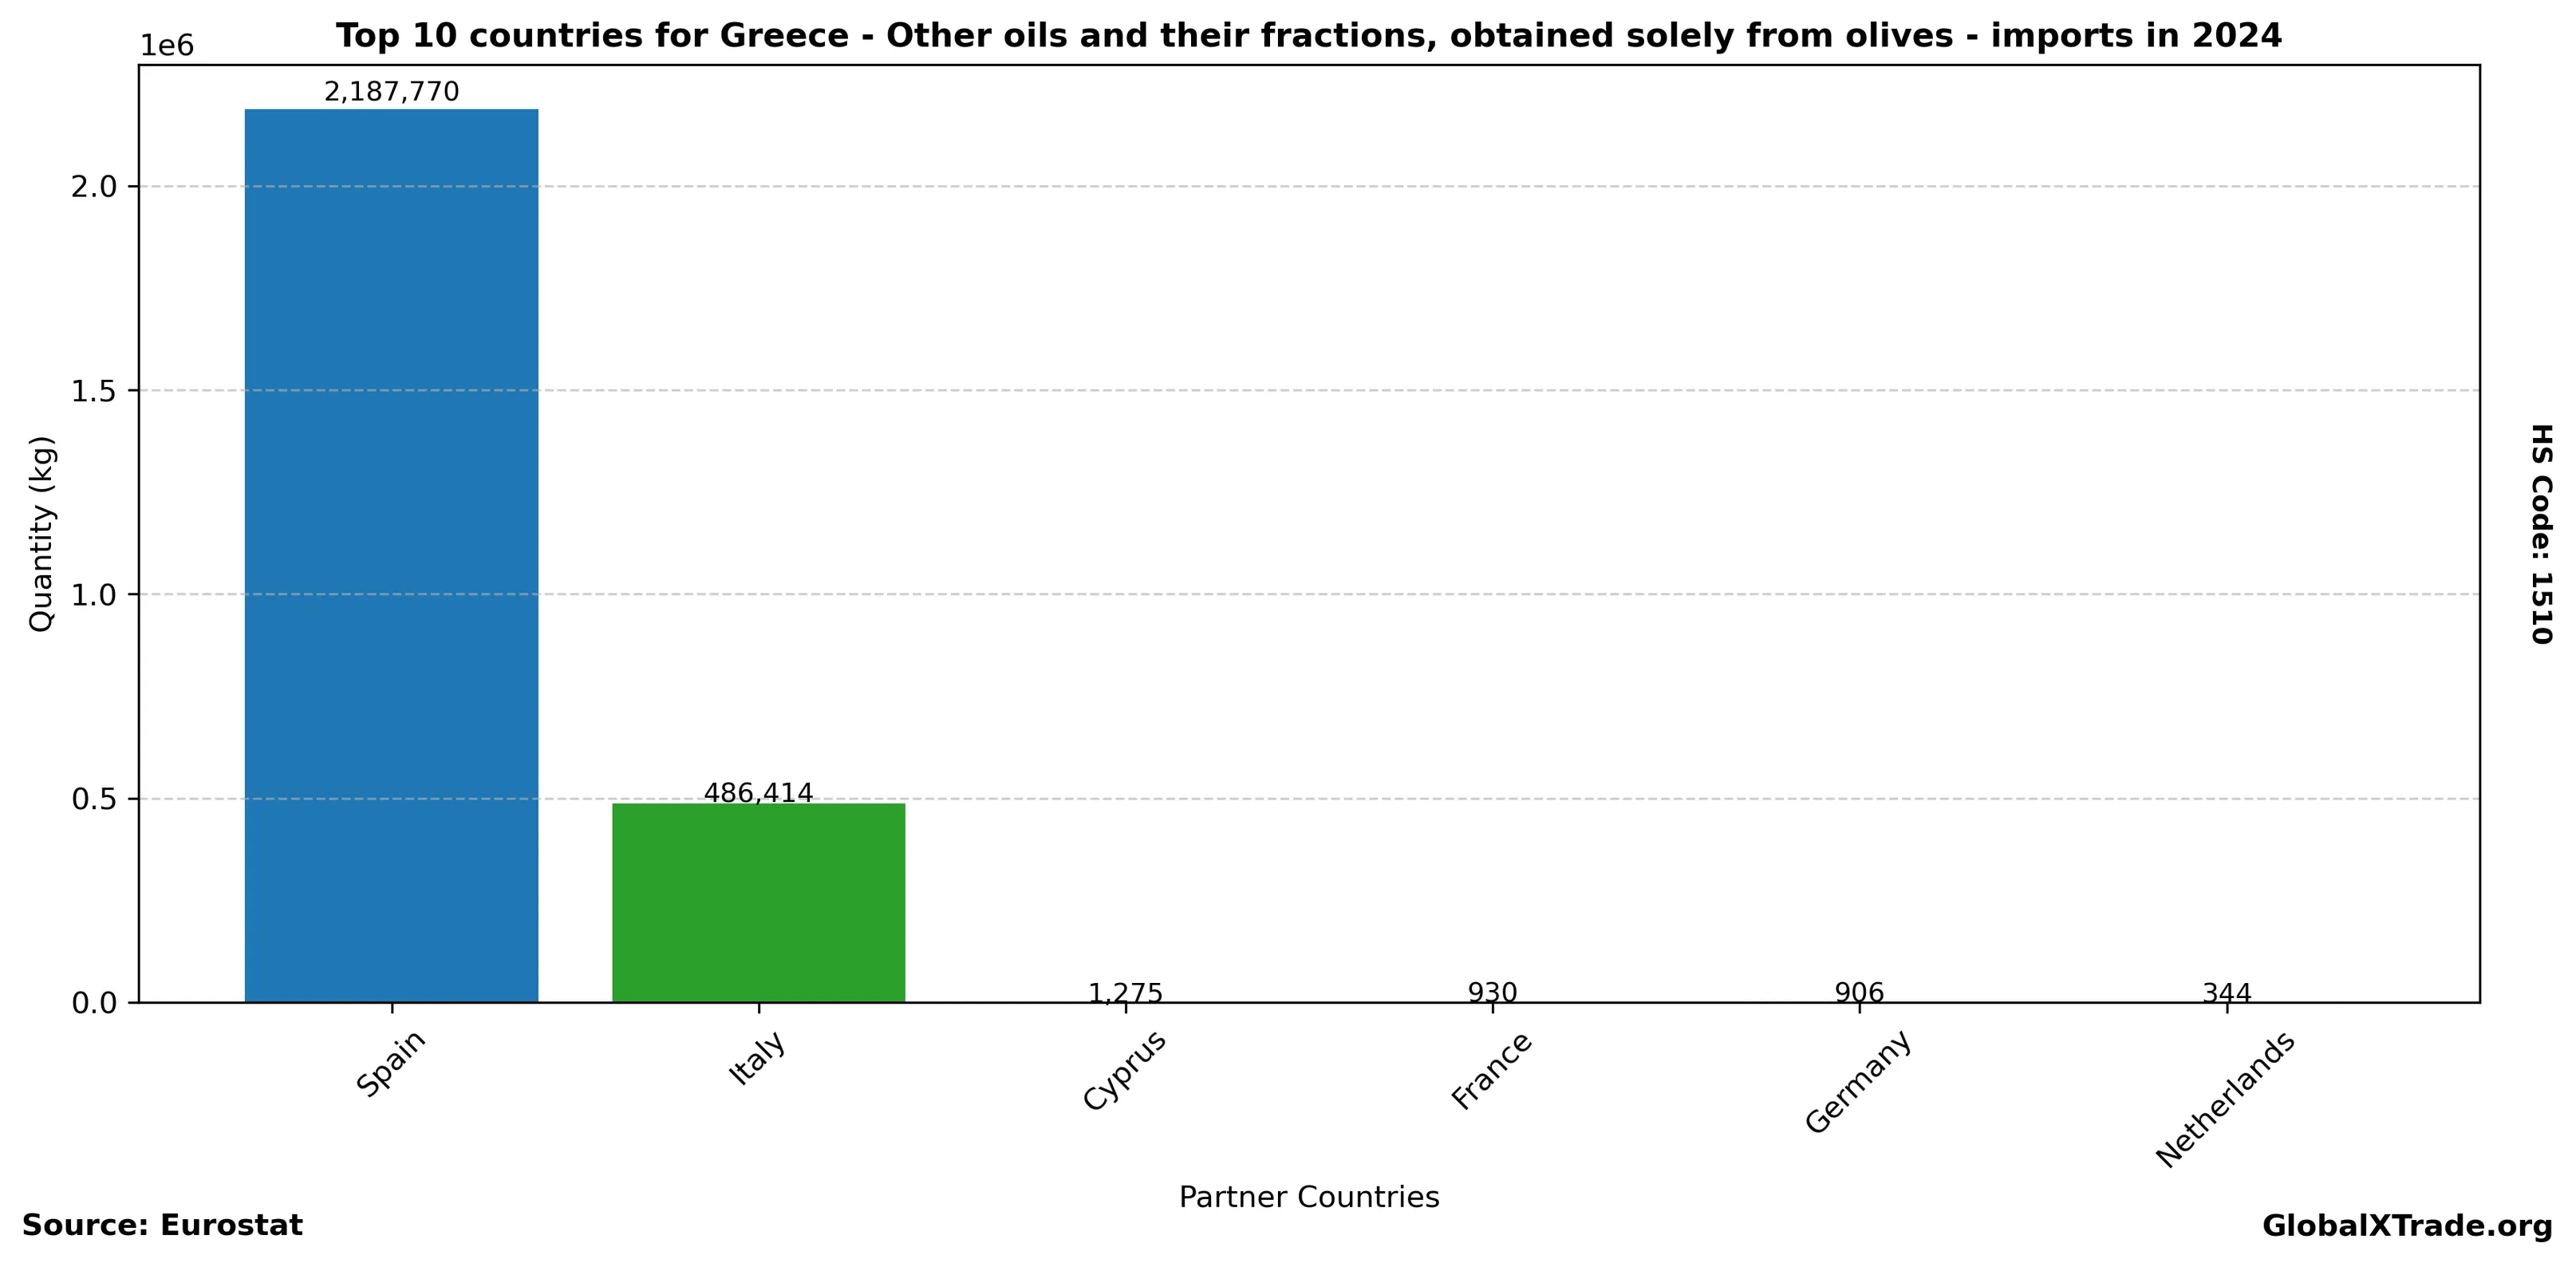
Top Partner Countries 2024
| partner | total_quantity_kg | total_value_eur |
|---|---|---|
| Spain | 2,187,770 | 8,246,412 |
| Italy | 486,414 | 1,820,232 |
| Cyprus | 1,275 | 2,551 |
| France | 930 | 5,602 |
| Germany | 906 | 5,001 |
| Netherlands | 344 | 5,410 |
Top Partner Countries 2023
| partner | total_quantity_kg | total_value_eur |
|---|---|---|
| Spain | 1,615,896 | 4,527,700 |
| Italy | 160,350 | 532,455 |
| Slovakia | 6,480 | 101,664 |
| Germany | 5,047 | 27,859 |
| Netherlands | 2,623 | 8,836 |
| France | 1,064 | 7,043 |
| Bulgaria | 716 | 3,152 |
| Malta | 5 | 41 |