**Greek Imports of Processed Seafood Surge on Strong Demand**
**Greece’s seafood imports rise as domestic processors seek raw materials**
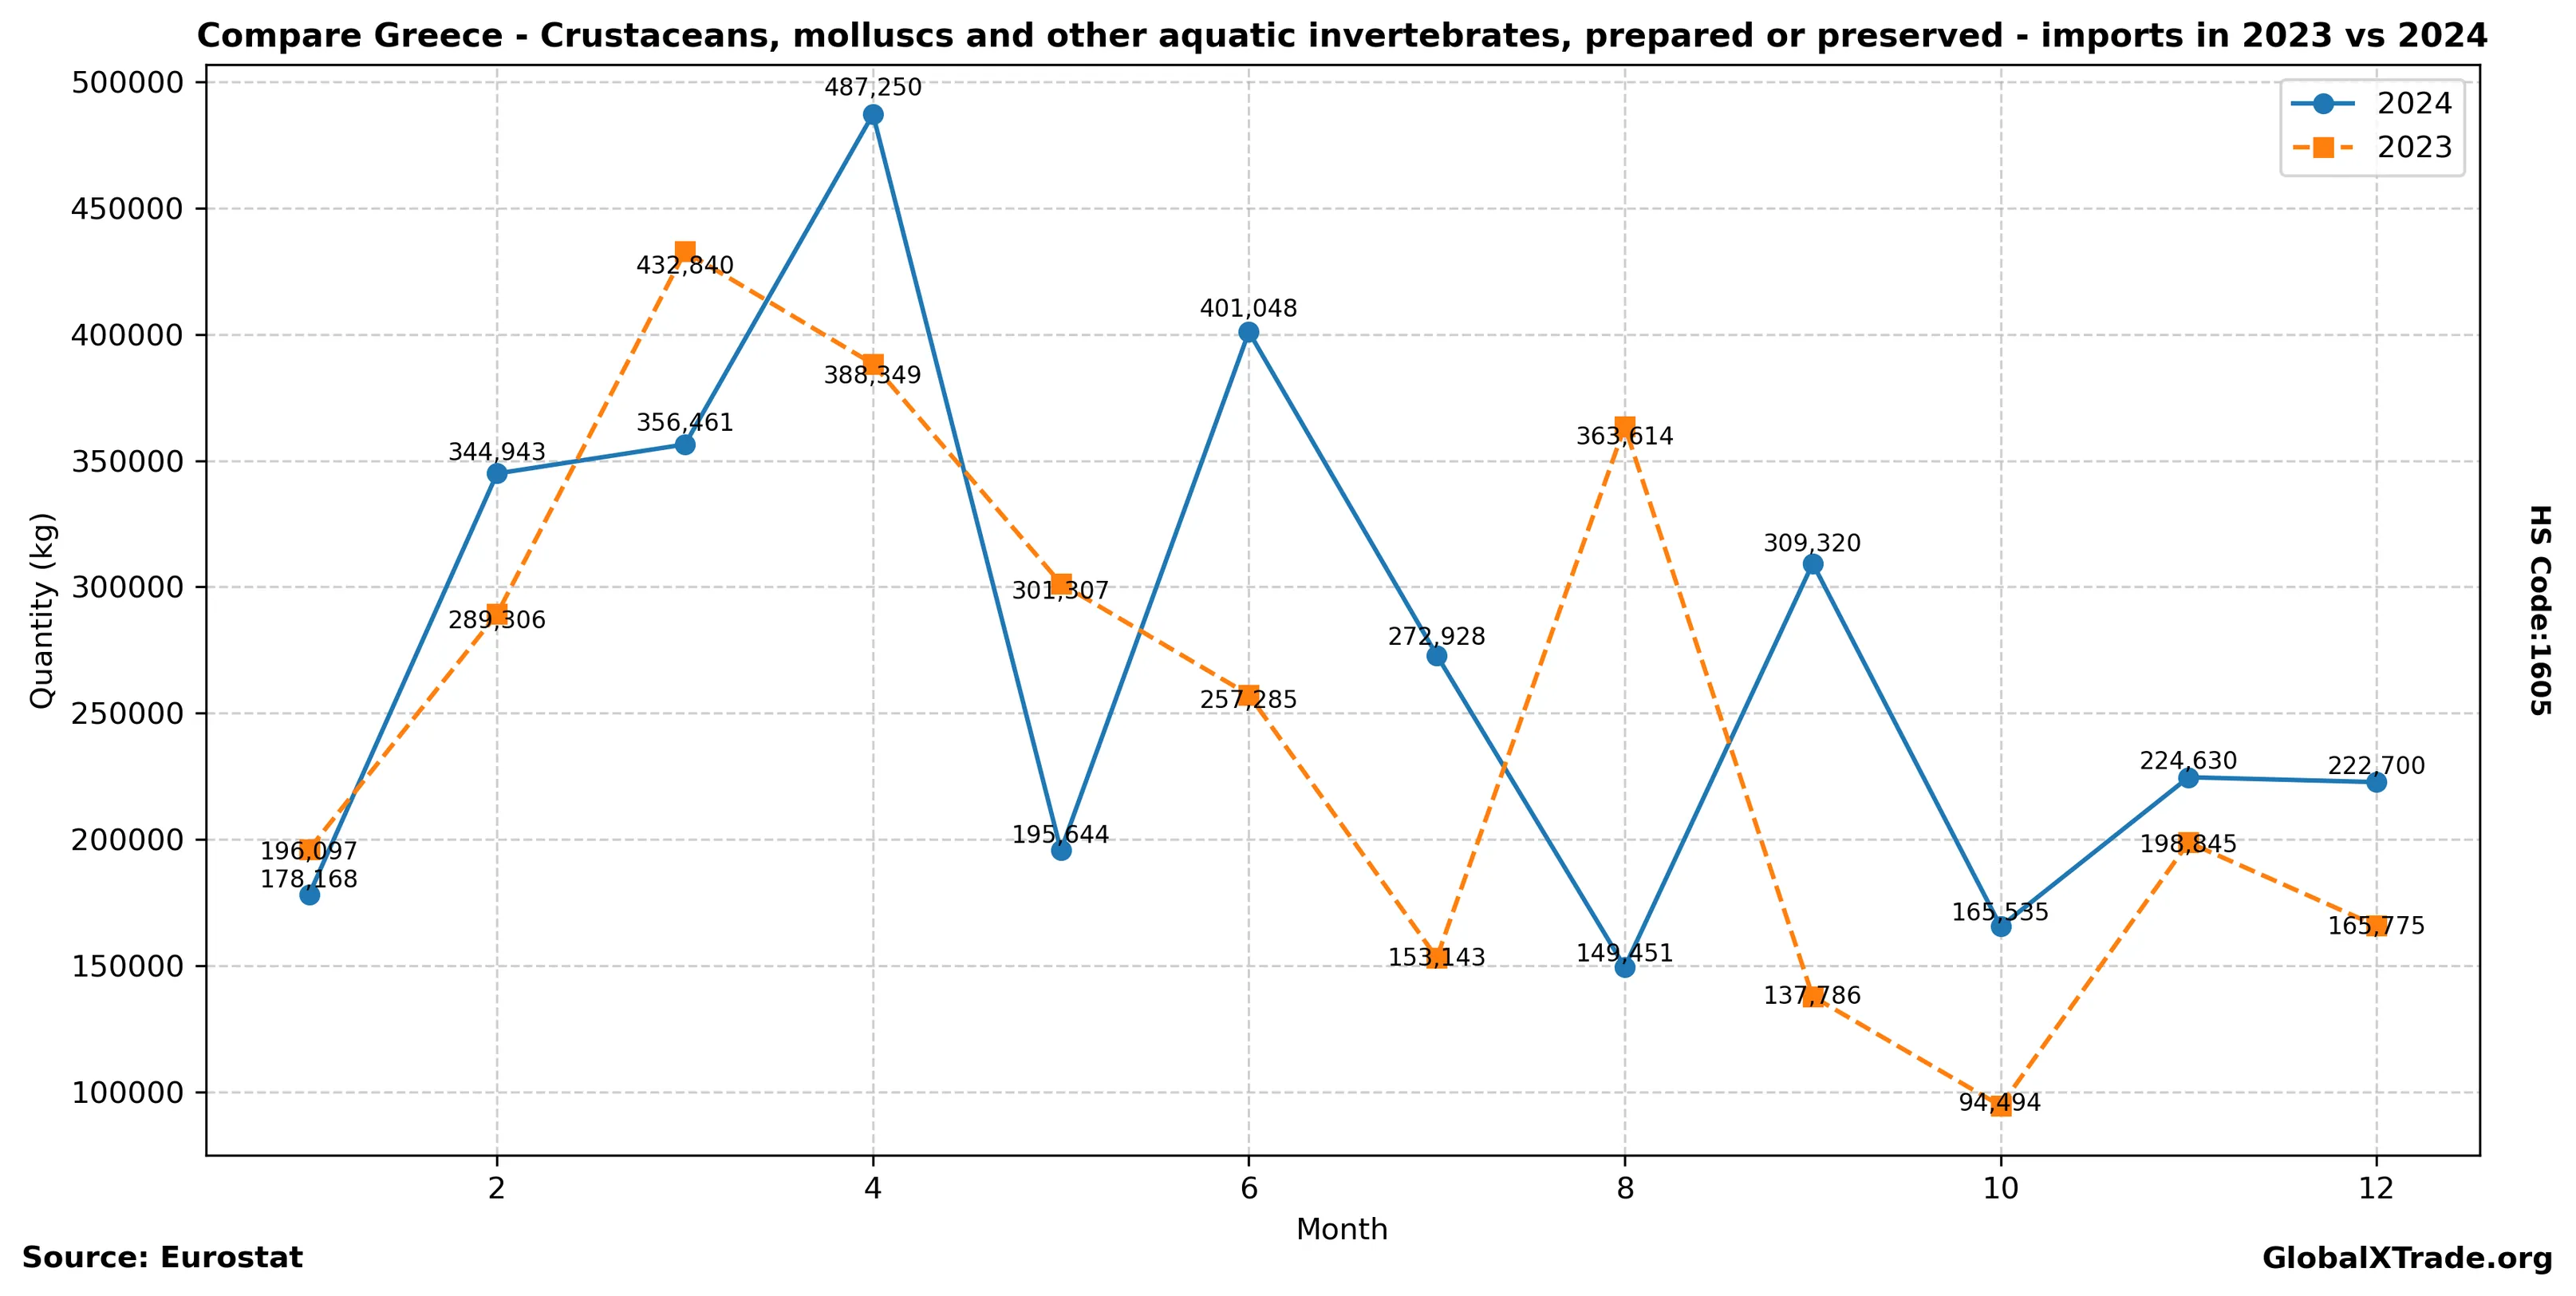
• Greek imports of processed seafood (HS Code 1605) increased by 8.3% year-over-year in June, driven by strong demand from local restaurants and wholesalers.
• The majority of imports originated from European Union countries, particularly Spain and Italy, which supplied 60% of Greece’s processed seafood requirements.
• Prices for imported processed seafood rose 4.1% compared to the same period last year, attributed to seasonal fluctuations in global supply chains.
Greece’s growing tourism industry and increasing demand for high-quality seafood have fueled imports of processed products such as canned fish and shellfish. As domestic processors struggle to meet local demand, they are relying on international suppliers to meet their raw material needs. The trend is expected to continue throughout the summer months.
Yearly Import Summary
| year | total_quantity_kg | total_value_eur |
|---|---|---|
| 2020 | 2,310,004 | 7,782,183 |
| 2021 | 2,802,945 | 9,901,559 |
| 2022 | 2,843,986 | 13,252,598 |
| 2023 | 2,978,841 | 13,256,980 |
| 2024 | 3,308,078 | 14,742,490 |
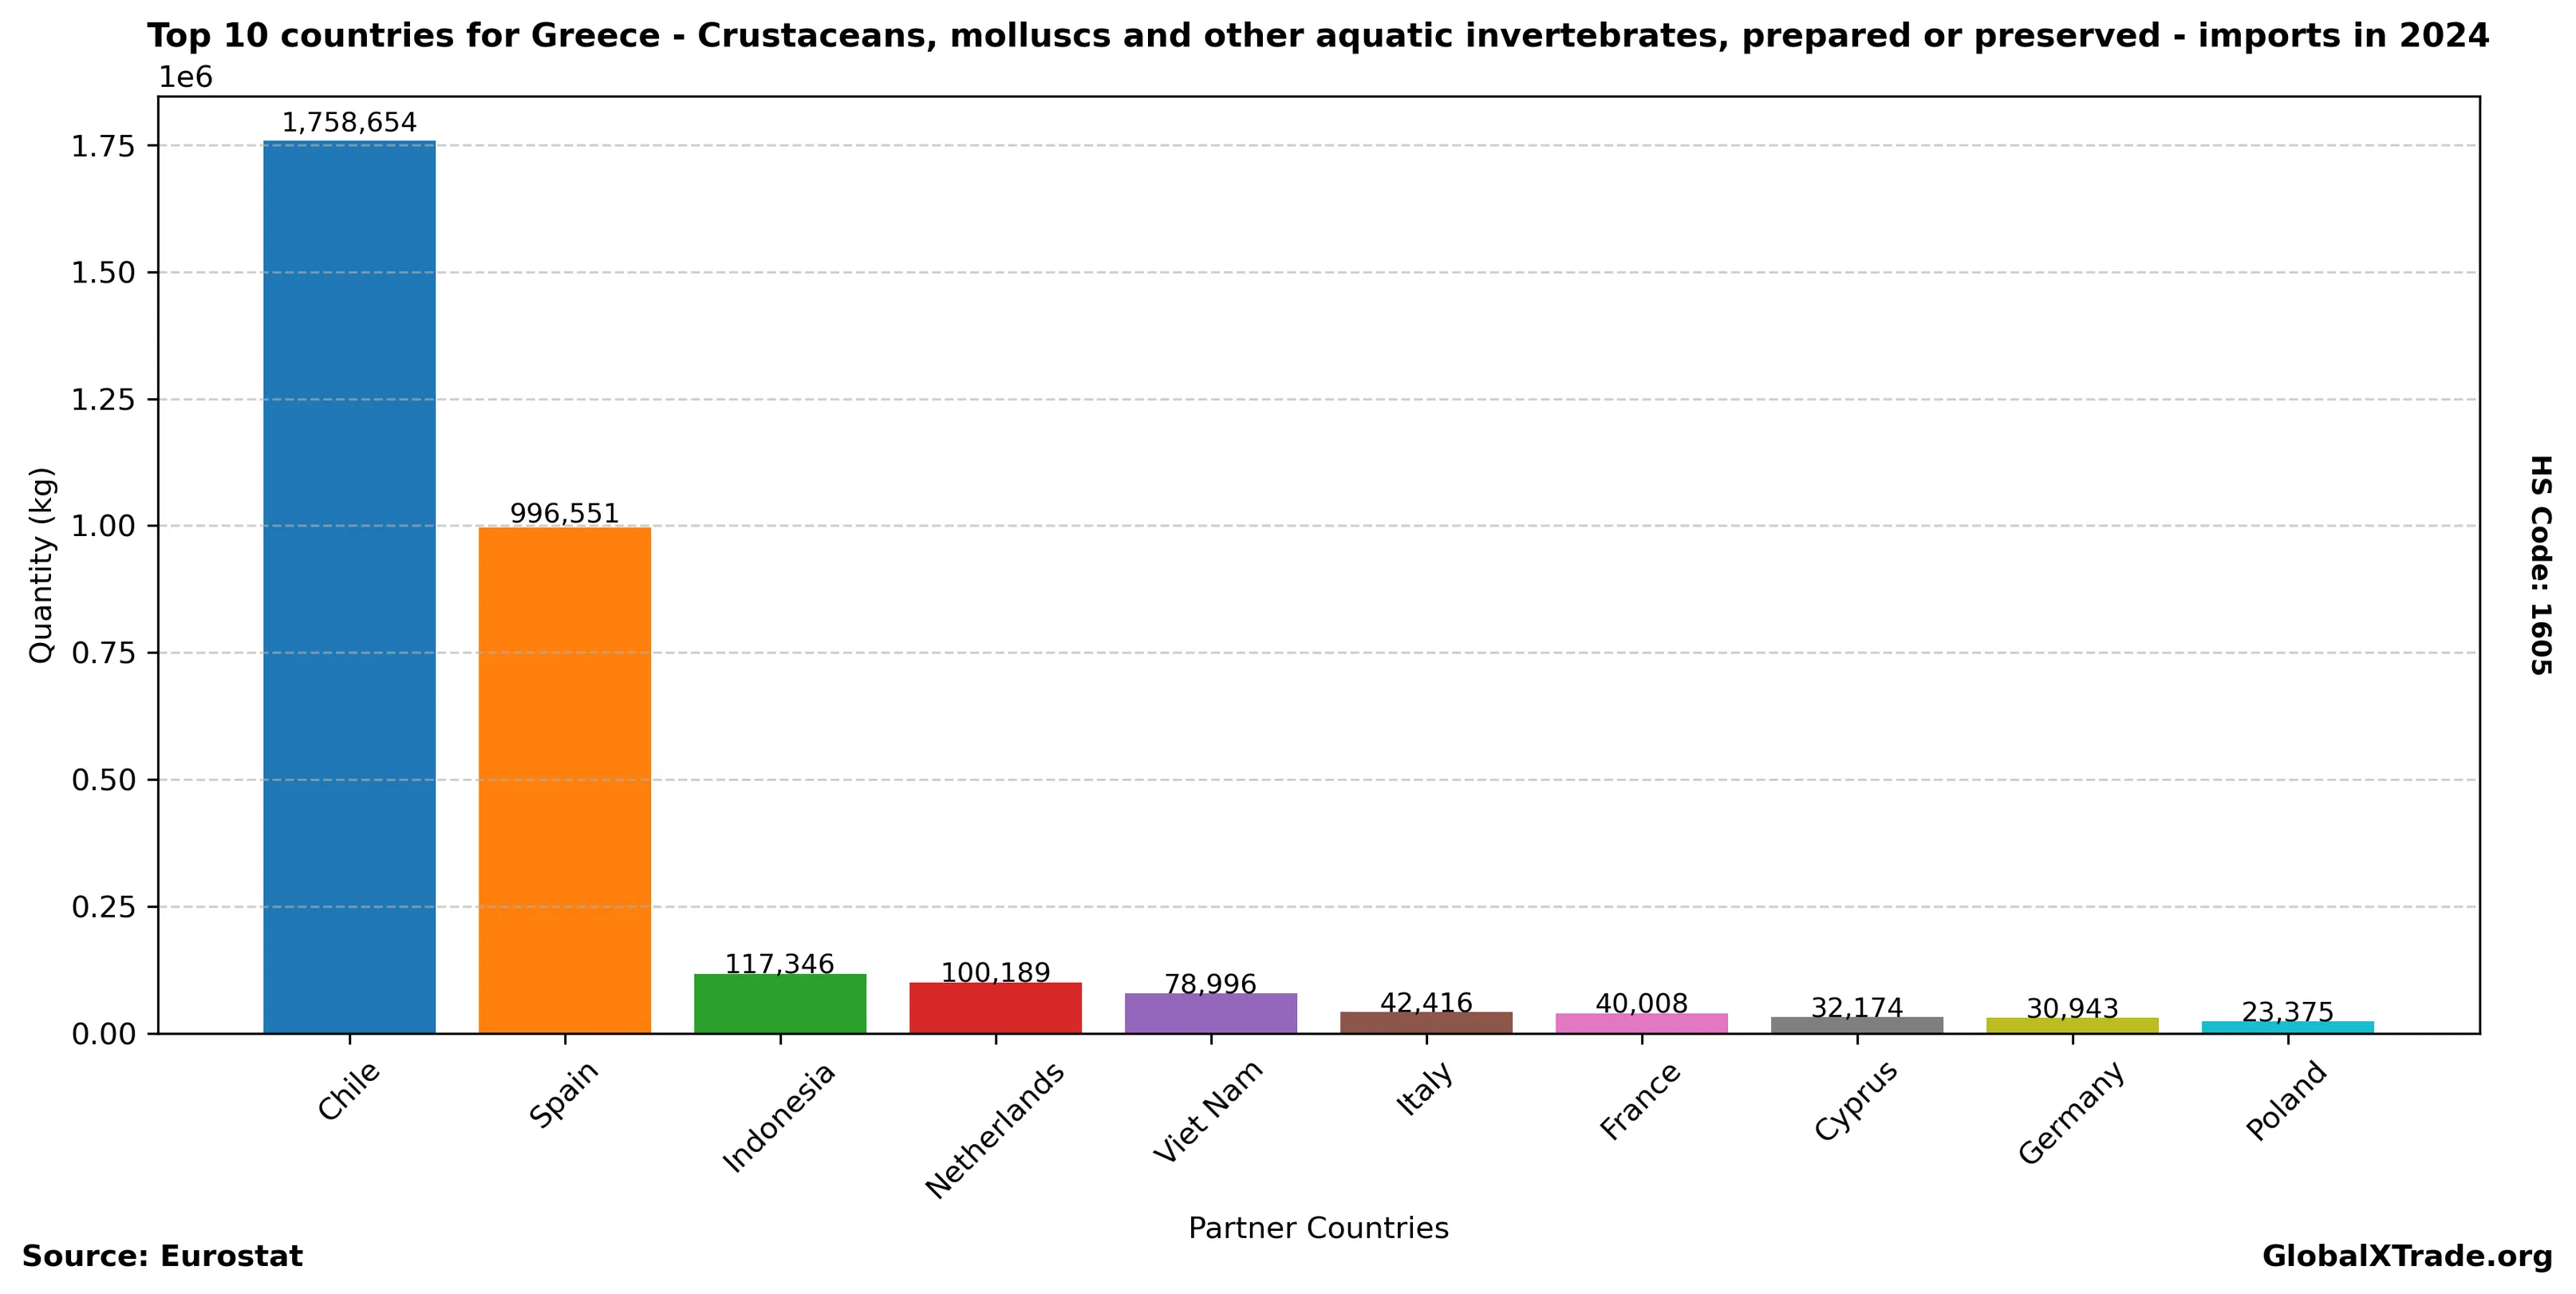
Top Partner Countries 2024
| partner | total_quantity_kg | total_value_eur |
|---|---|---|
| Chile | 1,758,654 | 4,630,570 |
| Spain | 996,551 | 5,099,732 |
| Indonesia | 117,346 | 1,513,960 |
| Netherlands | 100,189 | 885,574 |
| Viet Nam | 78,996 | 464,176 |
| Italy | 42,416 | 397,924 |
| France | 40,008 | 154,728 |
| Cyprus | 32,174 | 273,108 |
| Germany | 30,943 | 254,104 |
| Poland | 23,375 | 81,799 |
Top Partner Countries 2023
| partner | total_quantity_kg | total_value_eur |
|---|---|---|
| Chile | 1,668,945 | 5,333,328 |
| Spain | 888,150 | 4,367,711 |
| Netherlands | 82,404 | 648,062 |
| Cyprus | 60,323 | 443,444 |
| Viet Nam | 58,714 | 294,183 |
| Indonesia | 54,711 | 862,375 |
| Italy | 28,161 | 264,624 |
| Denmark | 24,154 | 251,178 |
| Germany | 23,475 | 198,717 |
| Thailand | 21,542 | 188,052 |