**Greek Imports of Processed Foods Rise Amid Seasonal Demand**
**Greek food manufacturers increase purchases to meet summer demand**
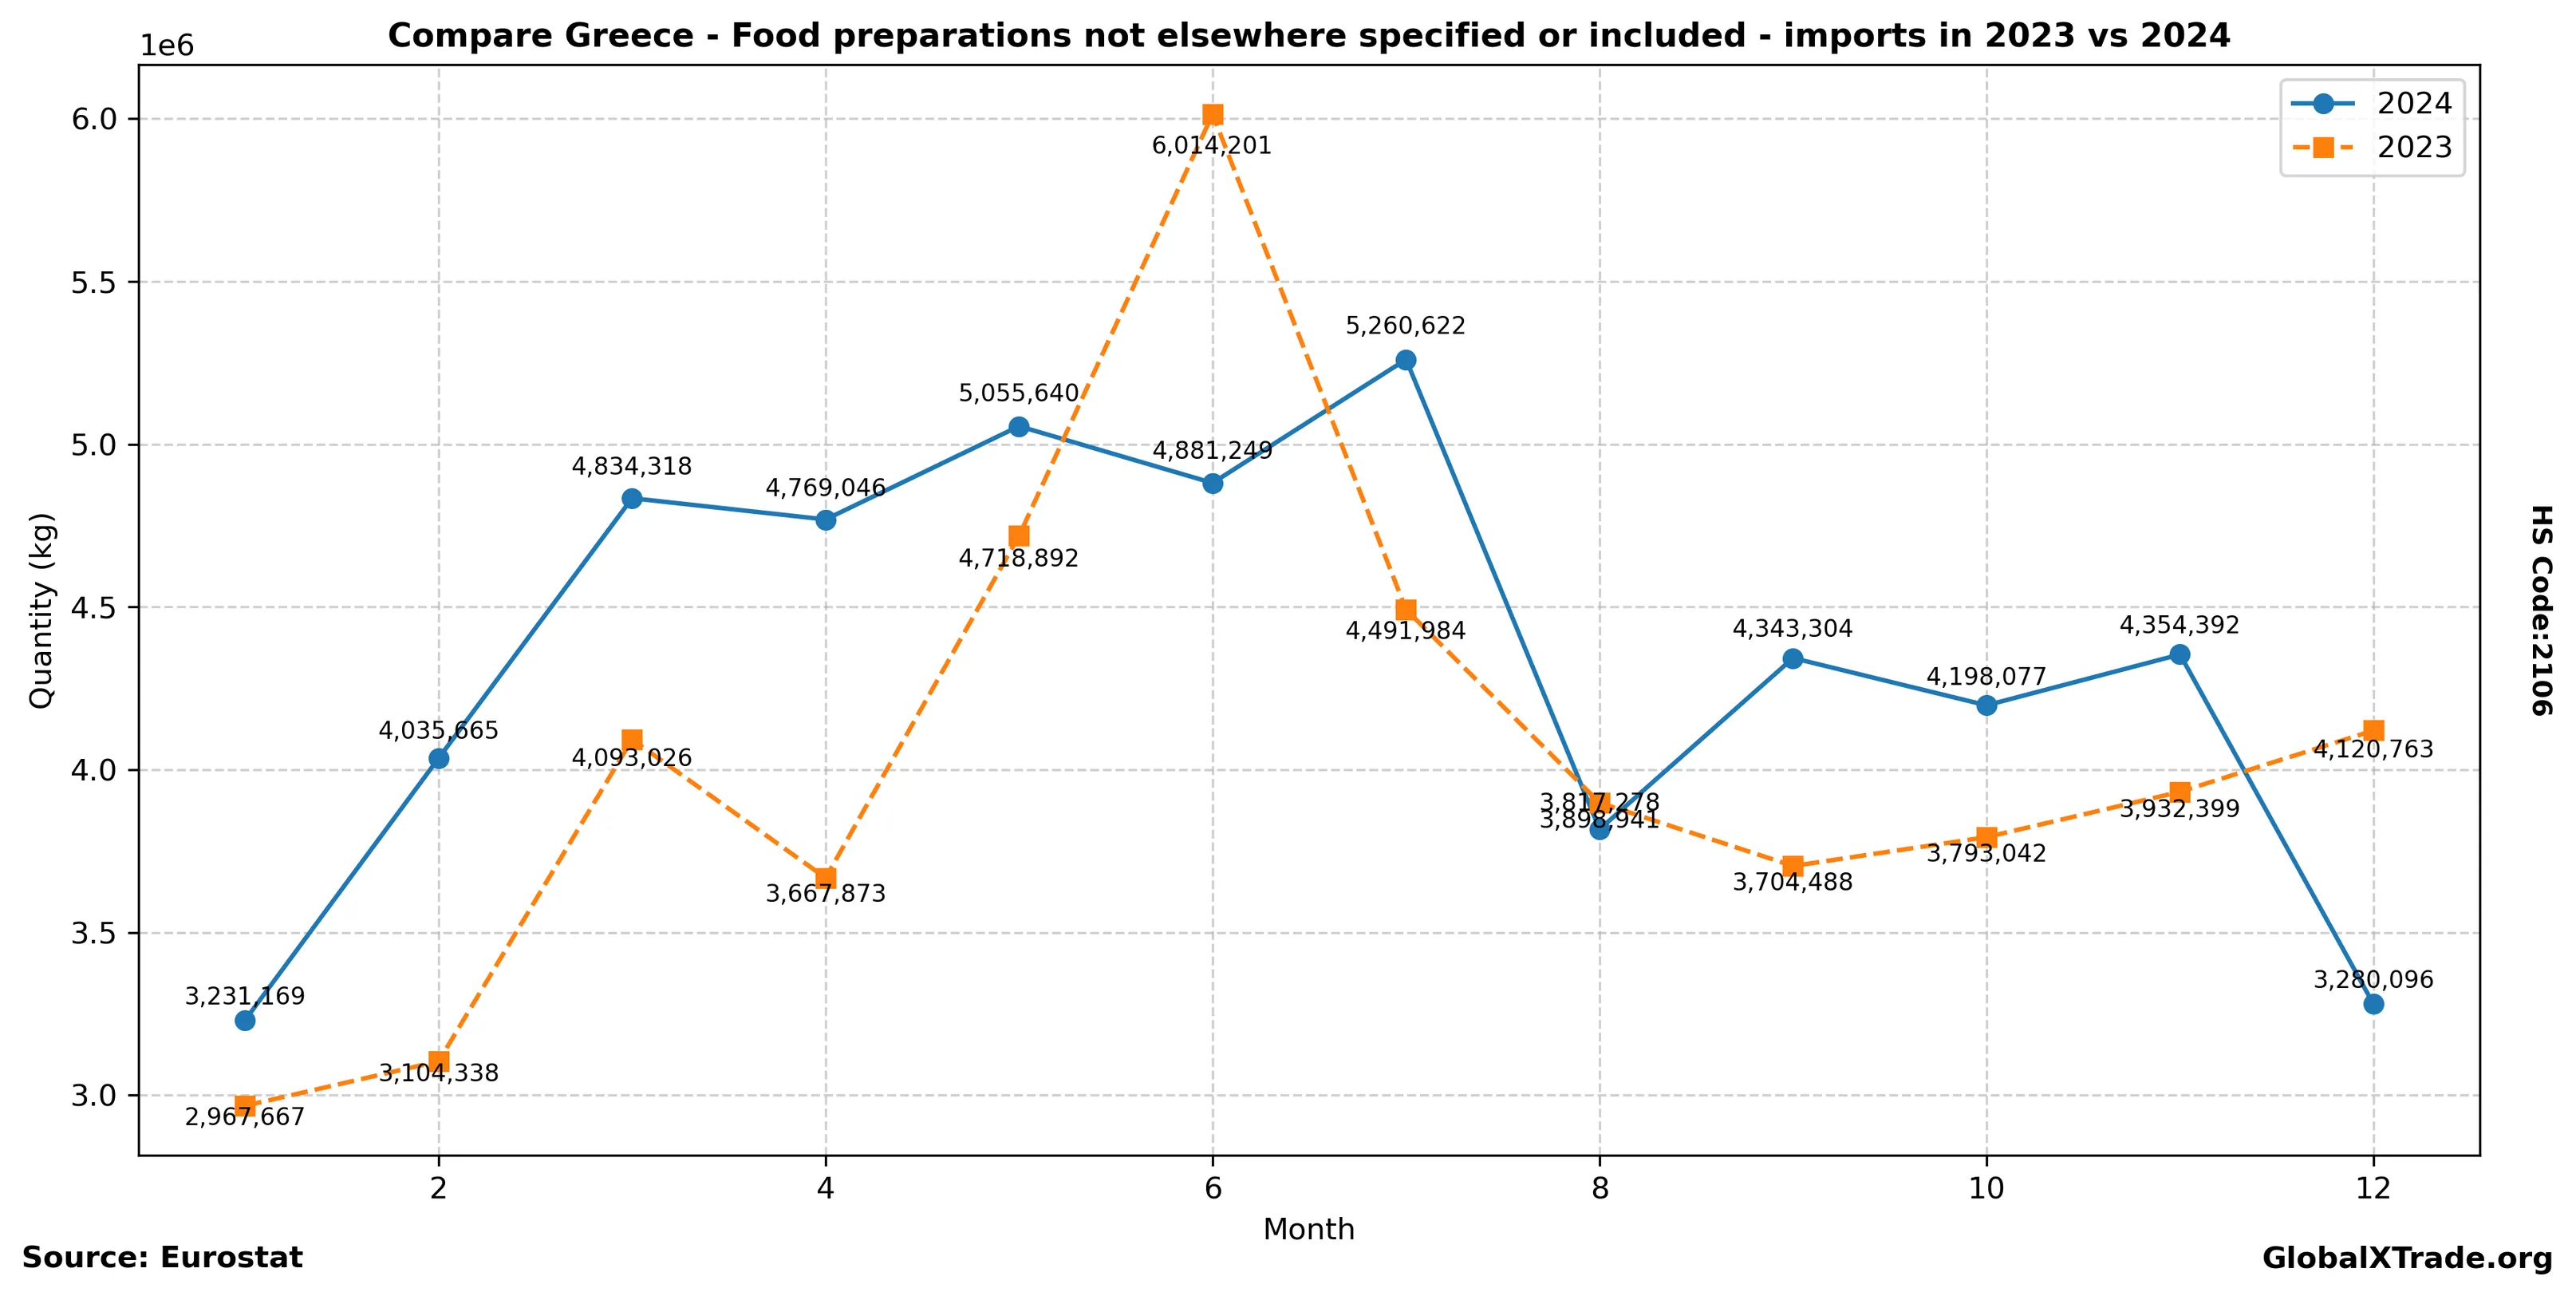
• Greek imports of processed foods, including canned goods and soups, rose 3.5% in the first half of July compared to the same period last year.
• The increase is attributed to growing demand from local retailers and restaurants ahead of the peak tourist season.
• Prices for these food products remain stable, with average import costs holding steady at around €1,200 per metric ton.
Greek food manufacturers are stepping up purchases of processed foods, including canned goods, soups, and sauces, in anticipation of increased sales during the summer months. Higher demand from local retailers and restaurants is driving imports, which have risen 3.5% so far this month.
Yearly Import Summary
| year | total_quantity_kg | total_value_eur |
|---|---|---|
| 2020 | 45,156,475 | 198,873,780 |
| 2021 | 45,931,782 | 223,310,935 |
| 2022 | 51,662,782 | 249,930,493 |
| 2023 | 48,507,614 | 240,566,341 |
| 2024 | 52,060,856 | 268,925,895 |
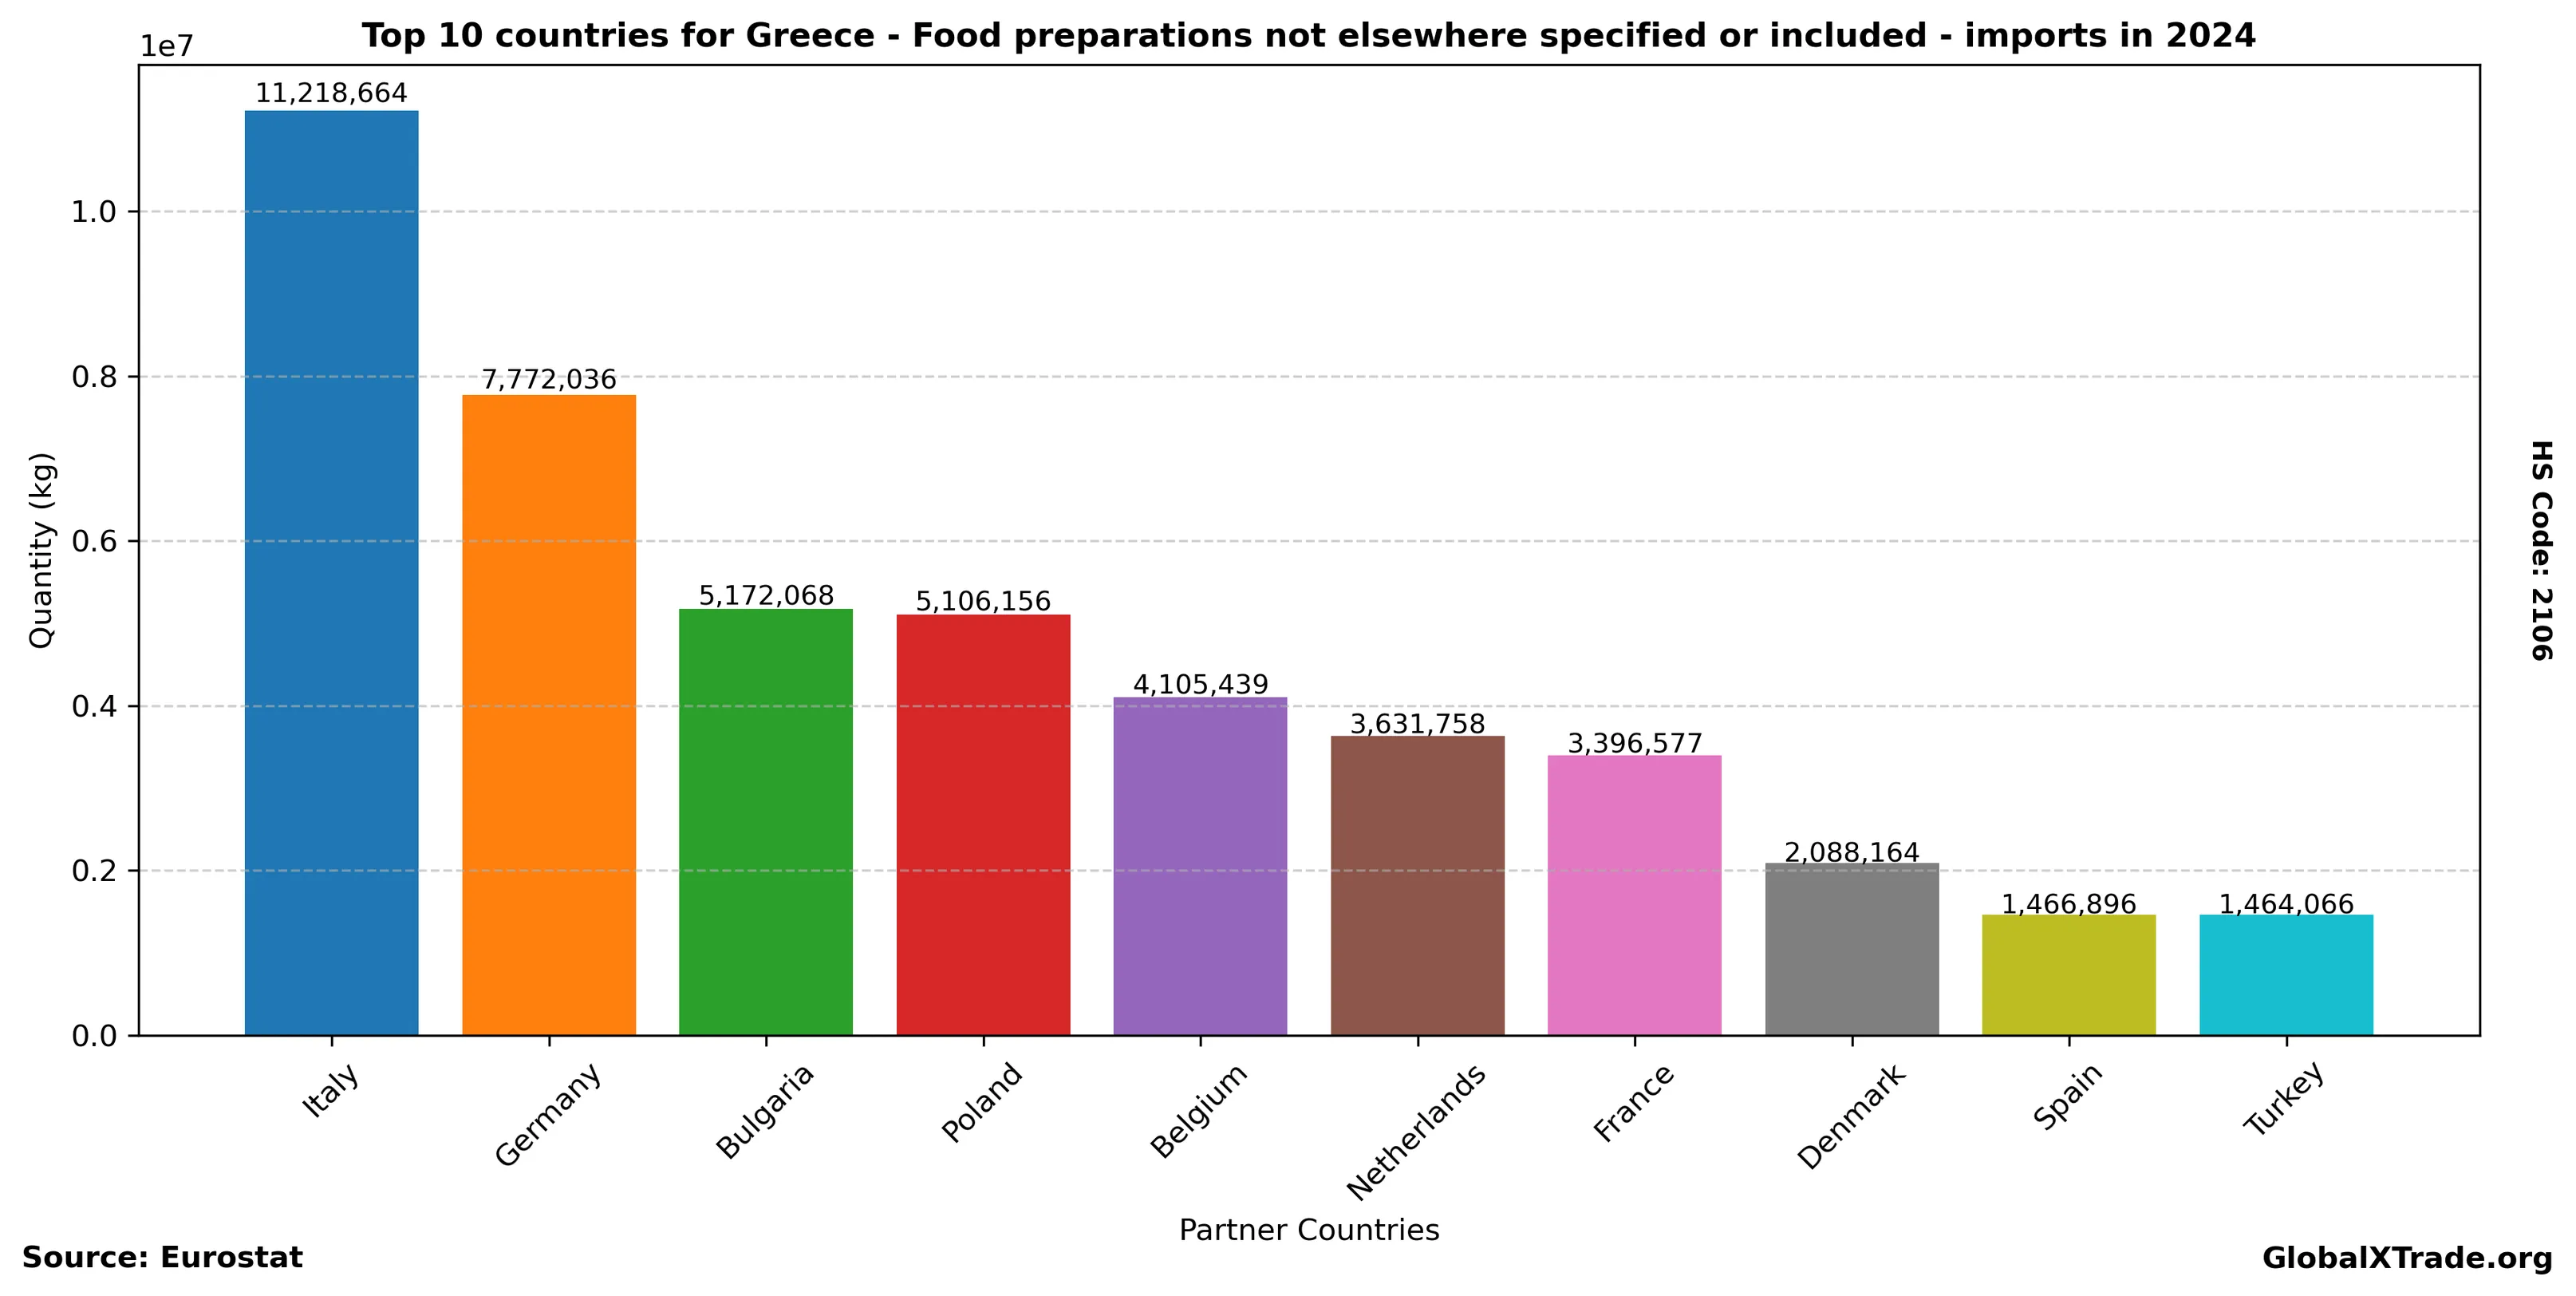
Top Partner Countries 2024
| partner | total_quantity_kg | total_value_eur |
|---|---|---|
| Italy | 11,218,664 | 43,939,282 |
| Germany | 7,772,036 | 37,872,998 |
| Bulgaria | 5,172,068 | 10,919,481 |
| Poland | 5,106,156 | 30,443,304 |
| Belgium | 4,105,439 | 12,863,581 |
| Netherlands | 3,631,758 | 25,663,006 |
| France | 3,396,577 | 19,241,373 |
| Denmark | 2,088,164 | 14,975,375 |
| Spain | 1,466,896 | 7,311,690 |
| Turkey | 1,464,066 | 11,916,616 |
Top Partner Countries 2023
| partner | total_quantity_kg | total_value_eur |
|---|---|---|
| Italy | 11,738,043 | 42,940,021 |
| Germany | 7,855,209 | 36,065,282 |
| Bulgaria | 4,759,694 | 10,679,659 |
| Poland | 3,405,151 | 20,544,061 |
| Belgium | 3,167,449 | 12,491,512 |
| Netherlands | 3,120,796 | 22,002,267 |
| France | 3,030,166 | 14,997,095 |
| Denmark | 2,035,011 | 14,788,787 |
| Spain | 1,512,778 | 8,448,128 |
| Turkey | 1,238,478 | 9,663,075 |