**Greek Importers Boost Soap and Detergent Purchases Amidst Seasonal Demand**
**Greece’s soap imports surge as summer vacation season approaches**
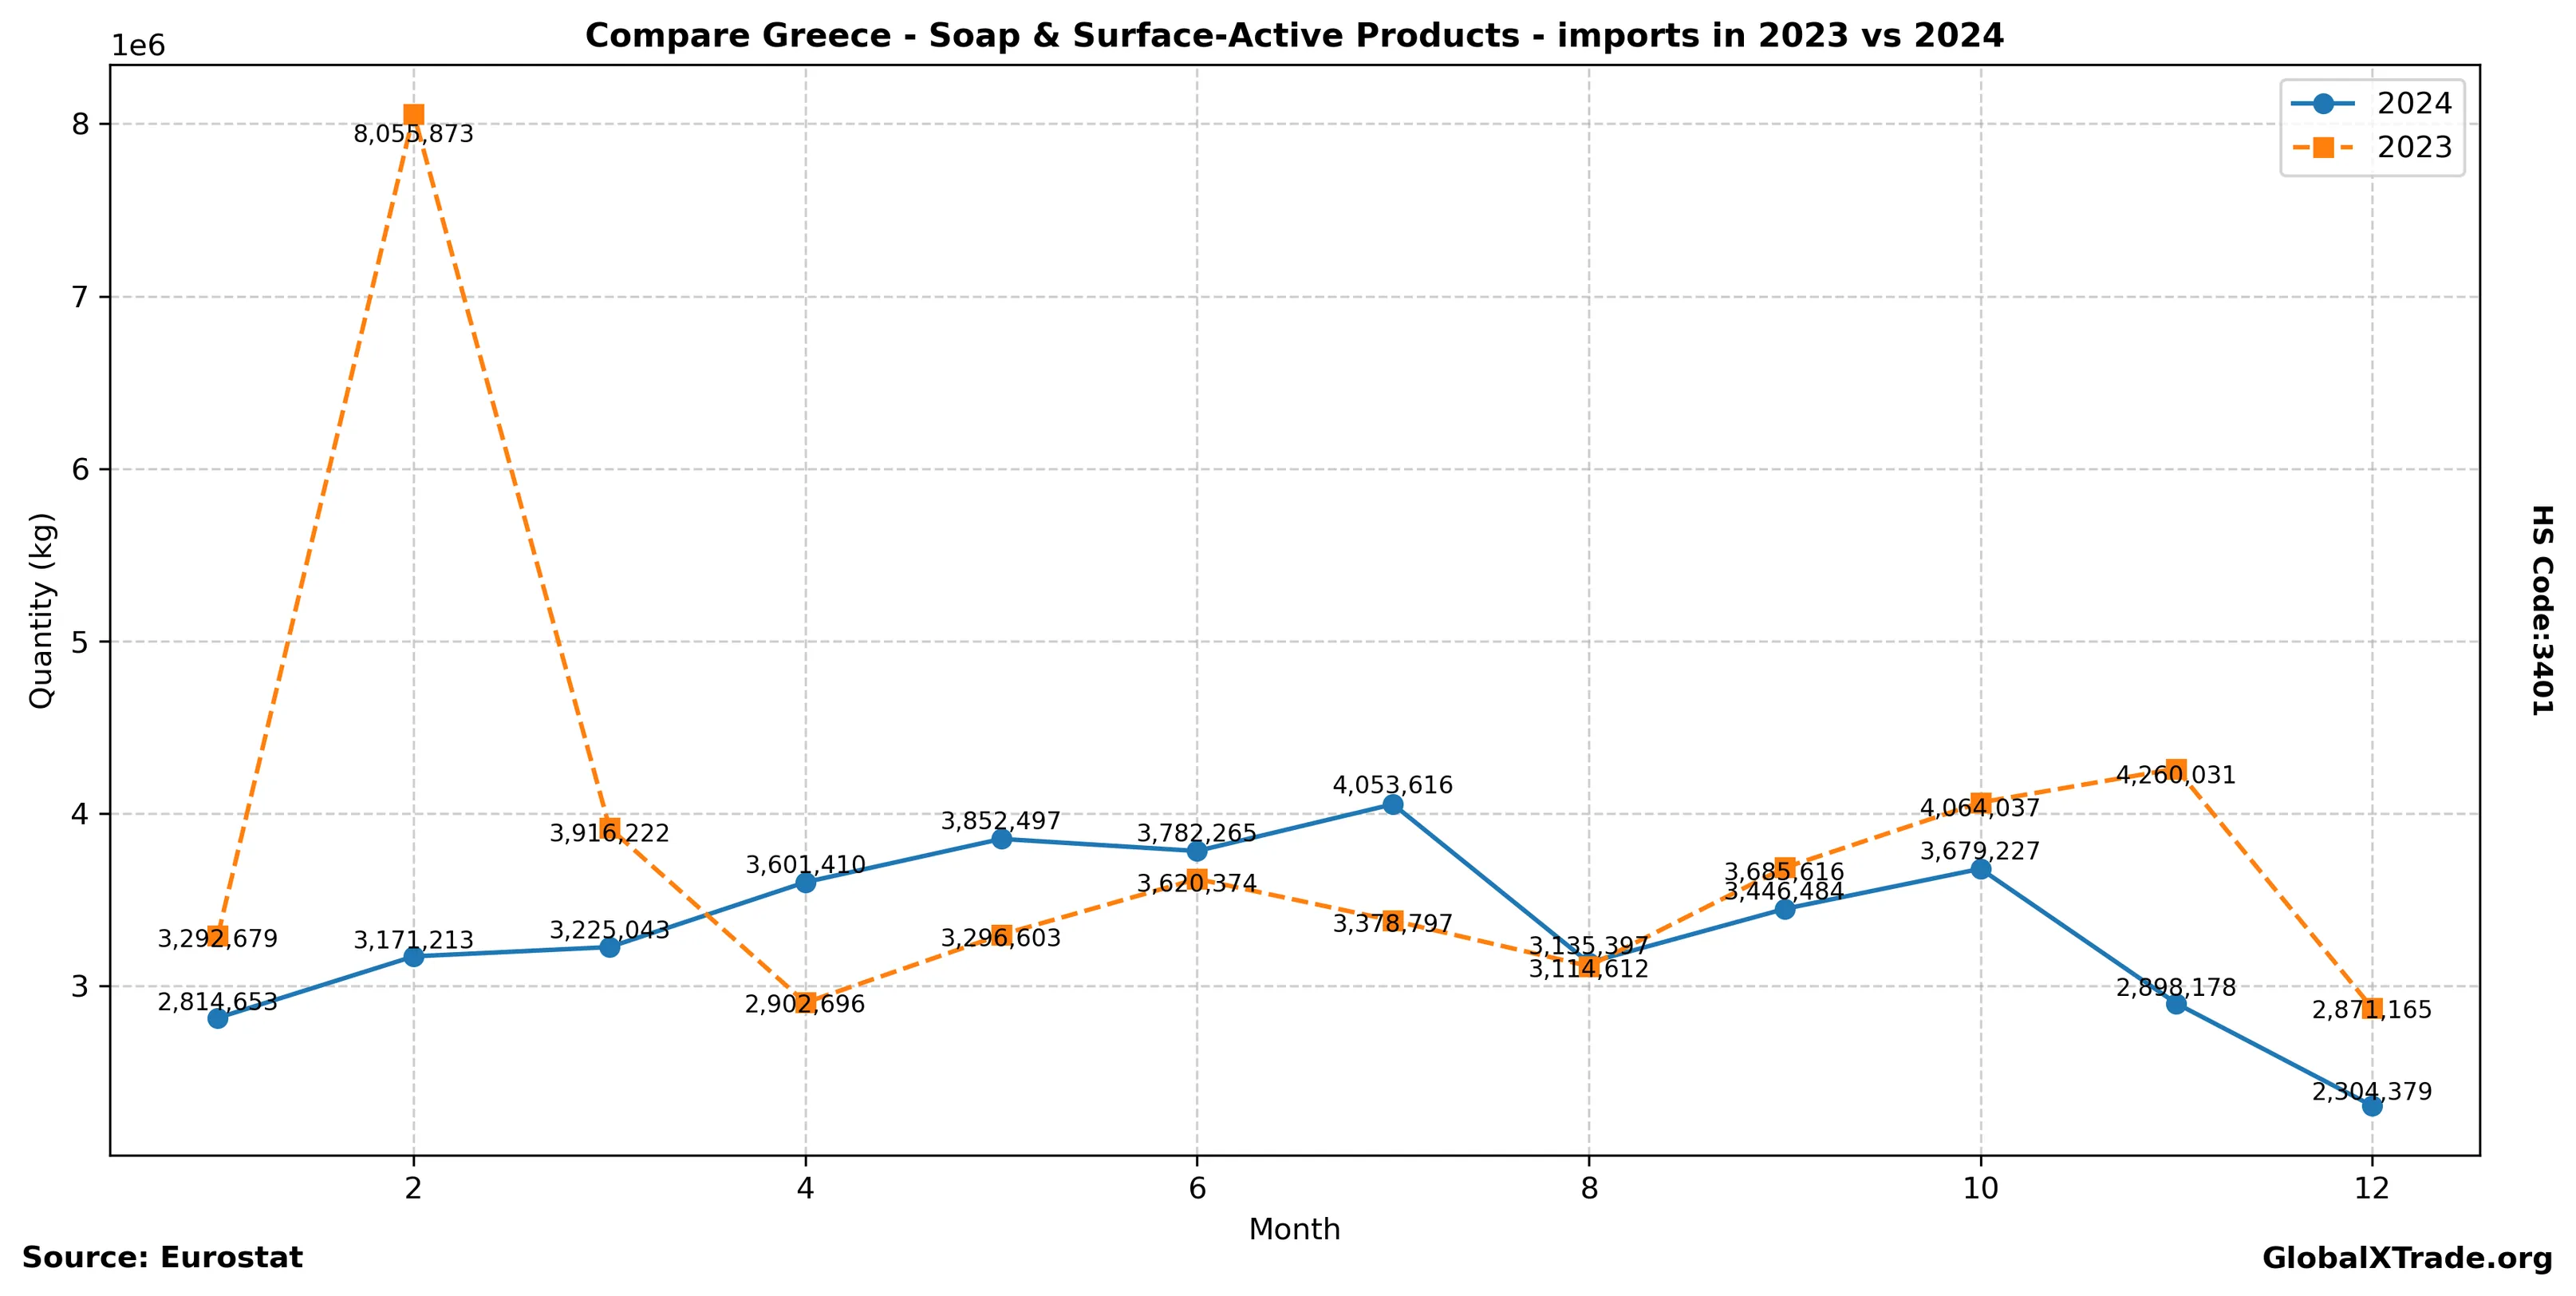
• Greece’s import of soap and surface-active products rose 5.7% year-over-year in May to $12.8 million.
• The increase is attributed to a boost in tourism, which drives demand for hotel and laundry supplies.
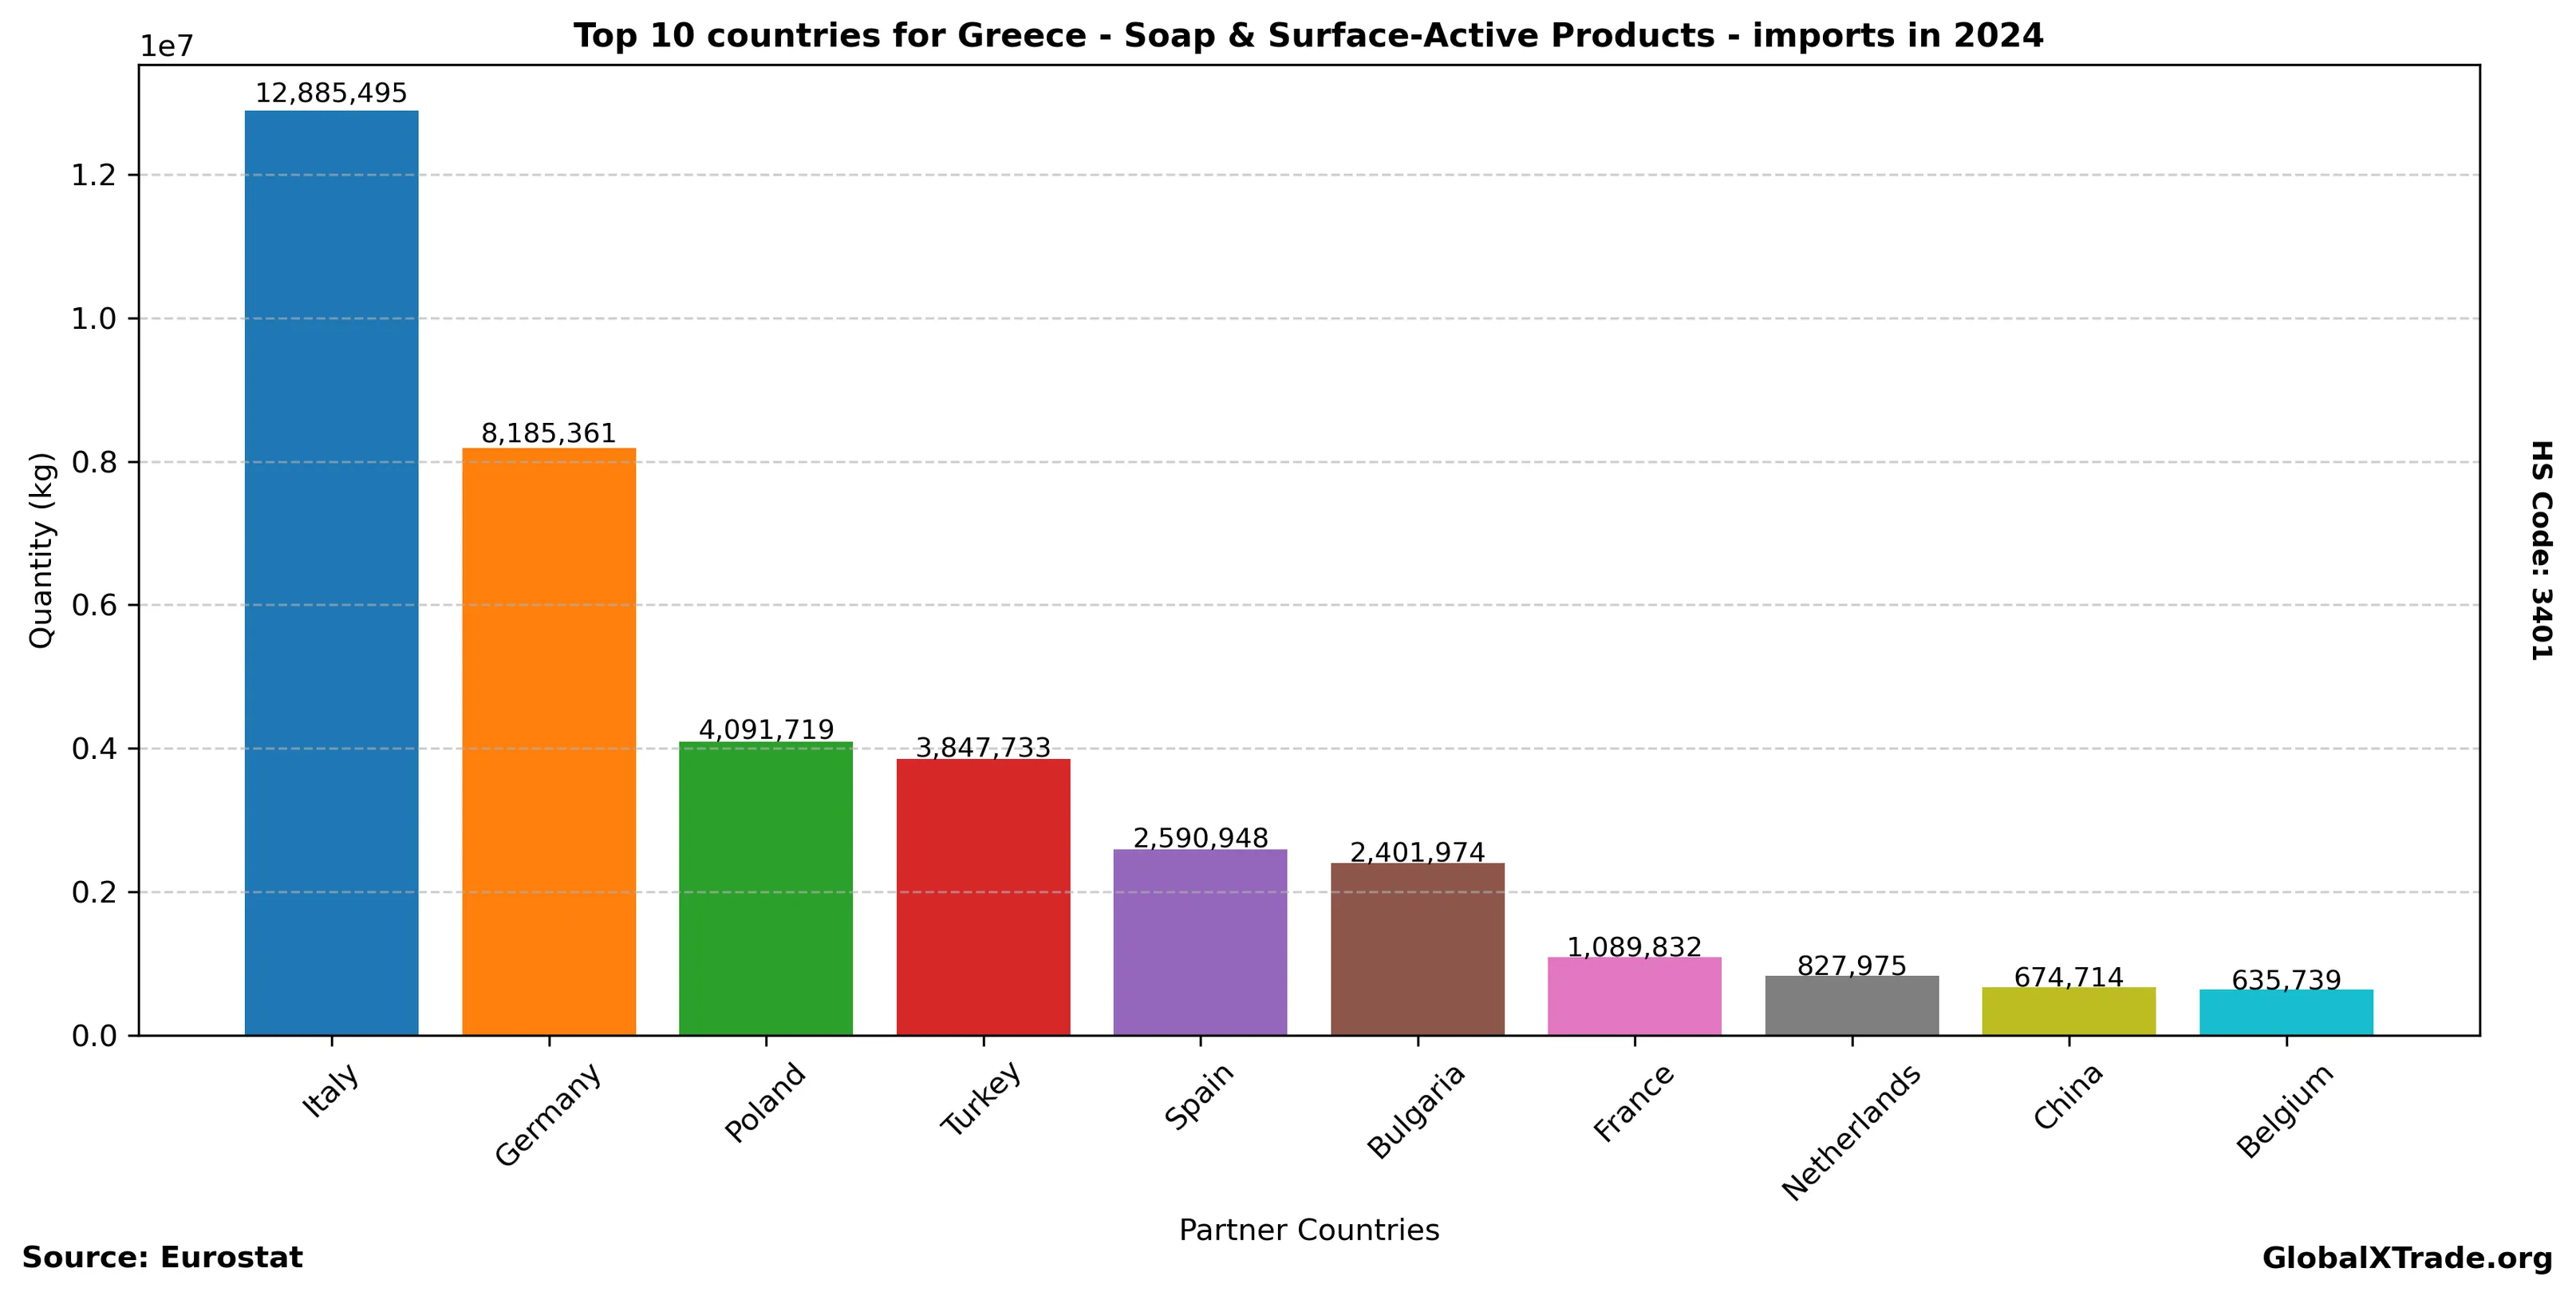
• European suppliers, particularly Germany and Italy, accounted for the majority of imports.
Greece’s economy is expected to benefit from a strong summer tourist season, with arrivals projected to reach pre-pandemic levels. As a result, importers are increasing their purchases of soap and surface-active products to meet the rising demand from hotels, restaurants, and households catering to tourists.
Yearly Import Summary
| year | total_quantity_kg | total_value_eur |
|---|---|---|
| 2020 | 37,559,320 | 56,336,029 |
| 2021 | 37,833,847 | 59,680,775 |
| 2022 | 44,679,308 | 76,364,704 |
| 2023 | 46,458,705 | 82,551,432 |
| 2024 | 39,964,362 | 78,329,299 |
Top Partner Countries 2024
| partner | total_quantity_kg | total_value_eur |
|---|---|---|
| Italy | 12,885,495 | 18,733,623 |
| Germany | 8,185,361 | 15,913,383 |
| Poland | 4,091,719 | 6,053,486 |
| Turkey | 3,847,733 | 4,350,313 |
| Spain | 2,590,948 | 4,704,041 |
| Bulgaria | 2,401,974 | 4,655,034 |
| France | 1,089,832 | 9,544,865 |
| Netherlands | 827,975 | 3,498,059 |
| China | 674,714 | 1,825,213 |
| Belgium | 635,739 | 1,576,148 |
Top Partner Countries 2023
| partner | total_quantity_kg | total_value_eur |
|---|---|---|
| Italy | 11,735,594 | 17,512,268 |
| Germany | 9,646,888 | 18,316,162 |
| Bulgaria | 9,145,271 | 8,322,662 |
| Poland | 4,952,663 | 7,573,095 |
| Turkey | 3,918,379 | 4,524,162 |
| Spain | 1,745,367 | 3,416,234 |
| Netherlands | 784,865 | 2,880,854 |
| France | 755,981 | 7,309,023 |
| China | 668,949 | 1,849,385 |
| Belgium | 378,116 | 1,469,879 |