**Greece Sees Surge in Imports of Industrial Fatty Acids**
**Greek Industry Buys More Imported Chemicals Amid Manufacturing Growth**
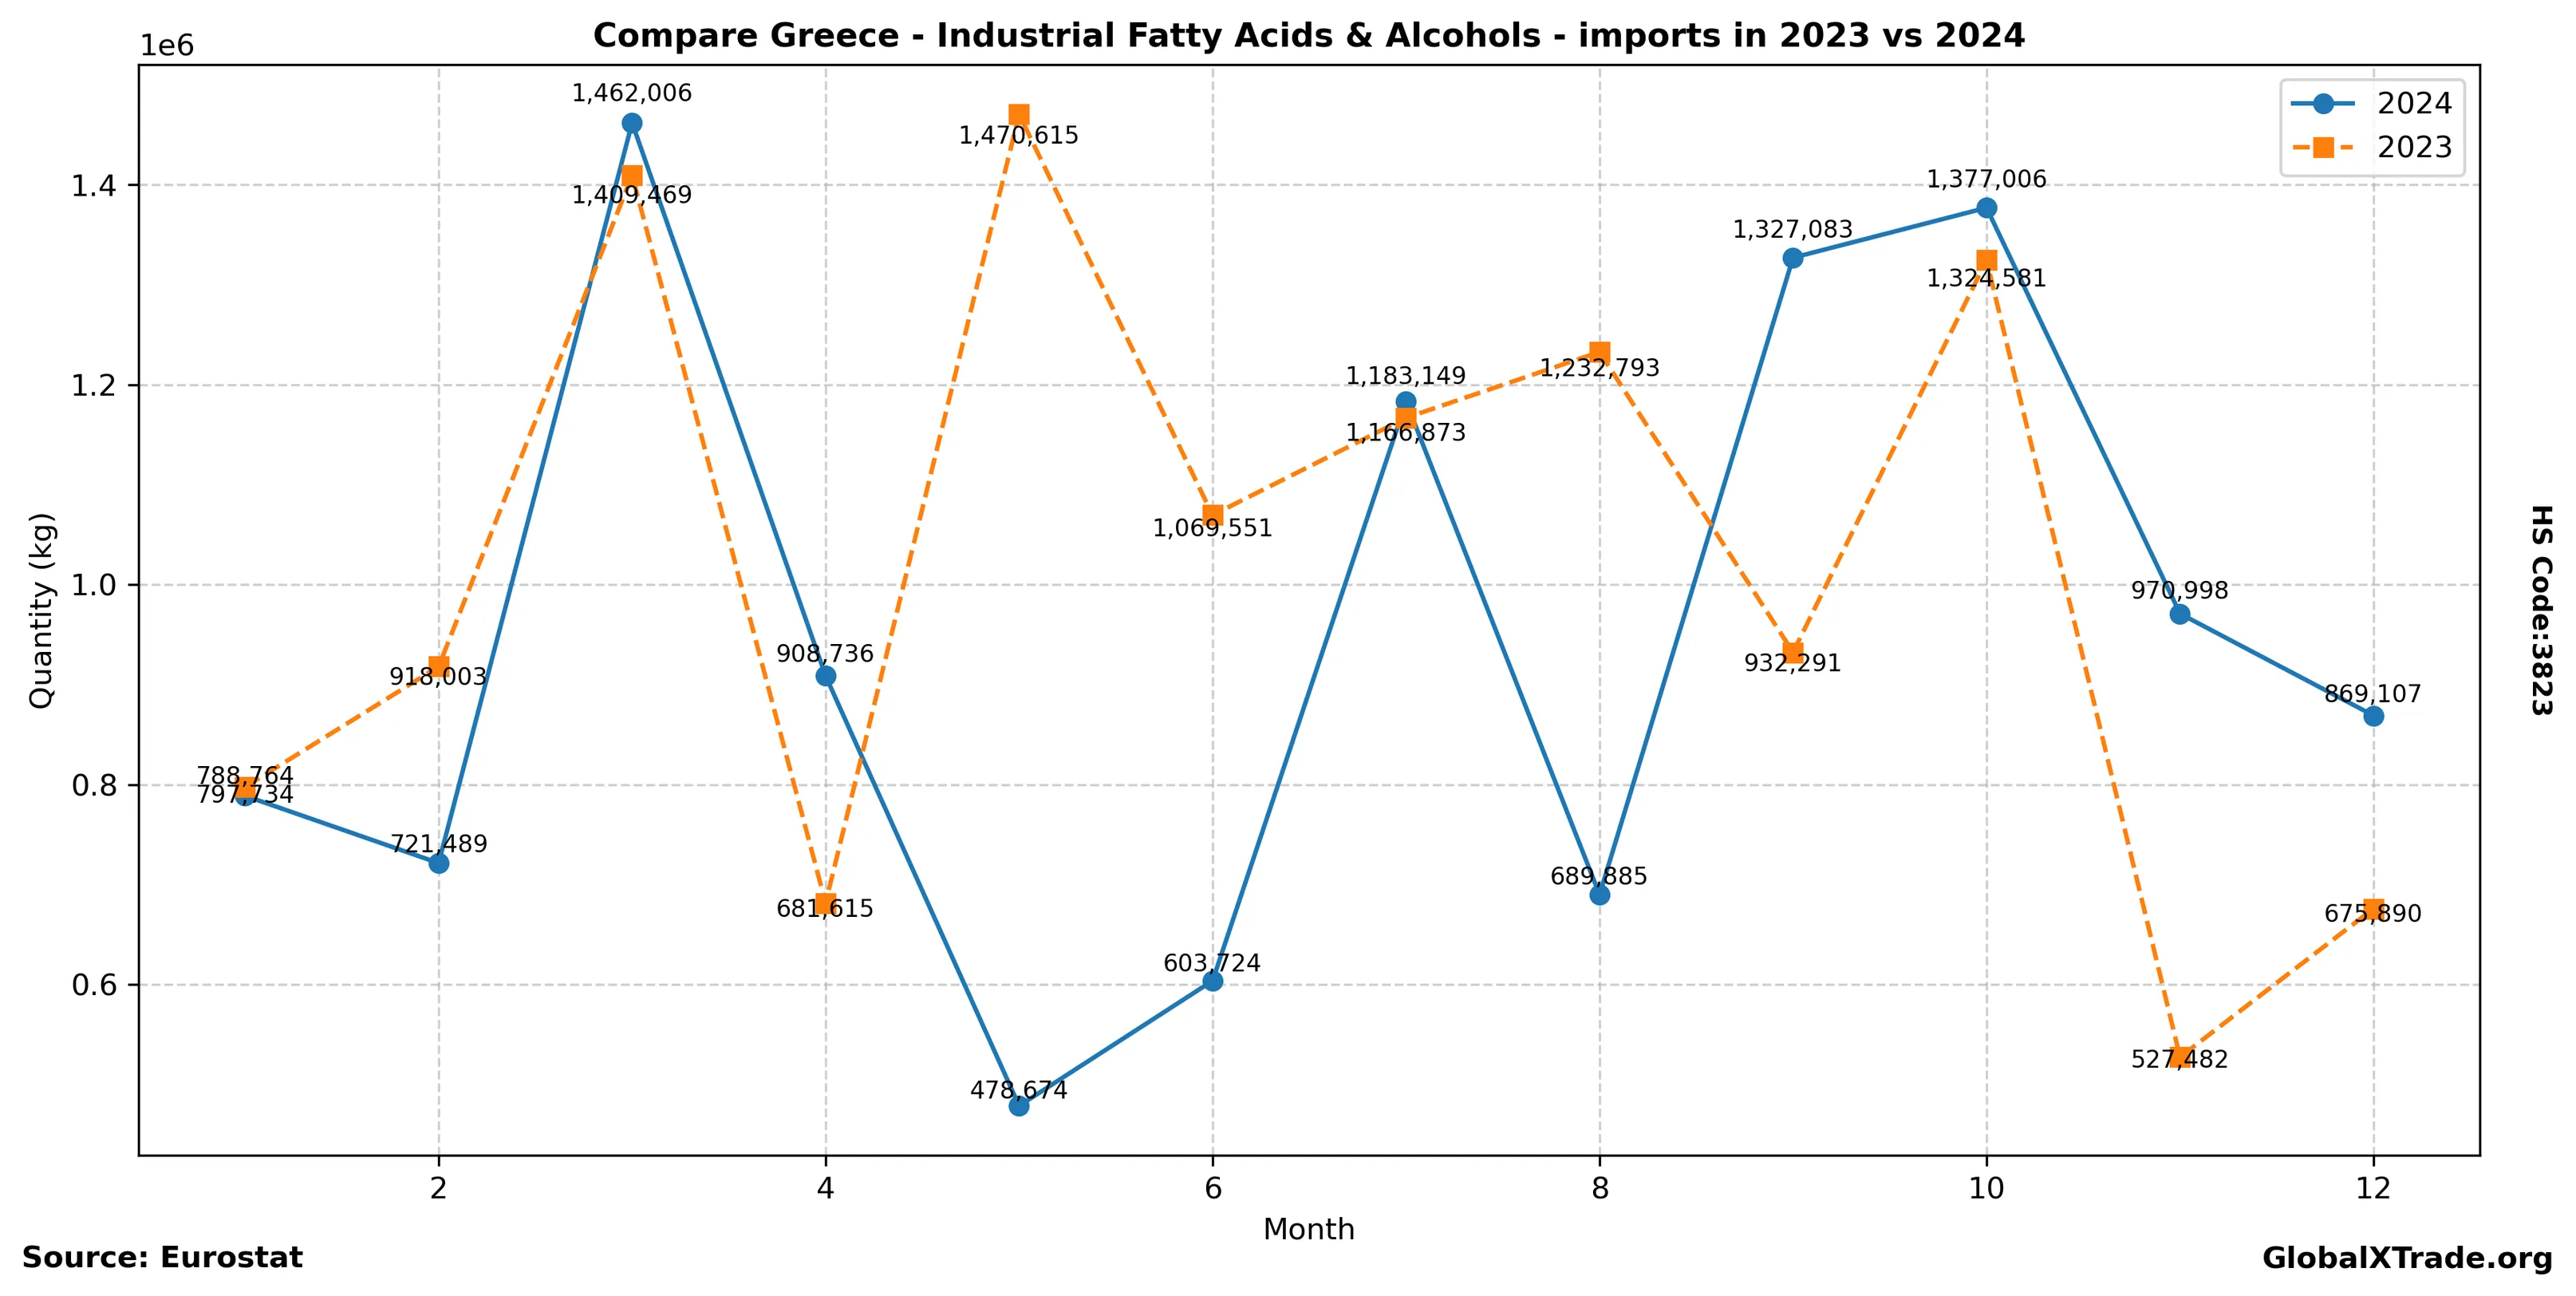
• Greece’s imports of industrial fatty acids and alcohols (HS Code 3823) rose by 8.5% year-over-year in June.
• The increase coincides with a seasonal peak in demand for chemical intermediates used in manufacturing, particularly in the pharmaceutical and cosmetics sectors.
• Prices for these chemicals have remained stable over the past quarter, influenced by steady global supply and moderate demand.
Greek industry’s growing appetite for imported industrial fatty acids and alcohols reflects its expanding production base. As Greece’s economy continues to recover from the pandemic-induced slowdown, domestic manufacturers are increasingly reliant on foreign suppliers to meet their chemical needs. Stronger-than-expected growth in the pharmaceutical sector has also driven up imports of these essential intermediates.
Yearly Import Summary
| year | total_quantity_kg | total_value_eur |
|---|---|---|
| 2020 | 11,577,137 | 12,020,522 |
| 2021 | 10,431,286 | 15,273,370 |
| 2022 | 10,761,999 | 21,884,376 |
| 2023 | 12,206,897 | 16,603,303 |
| 2024 | 11,380,621 | 17,875,148 |
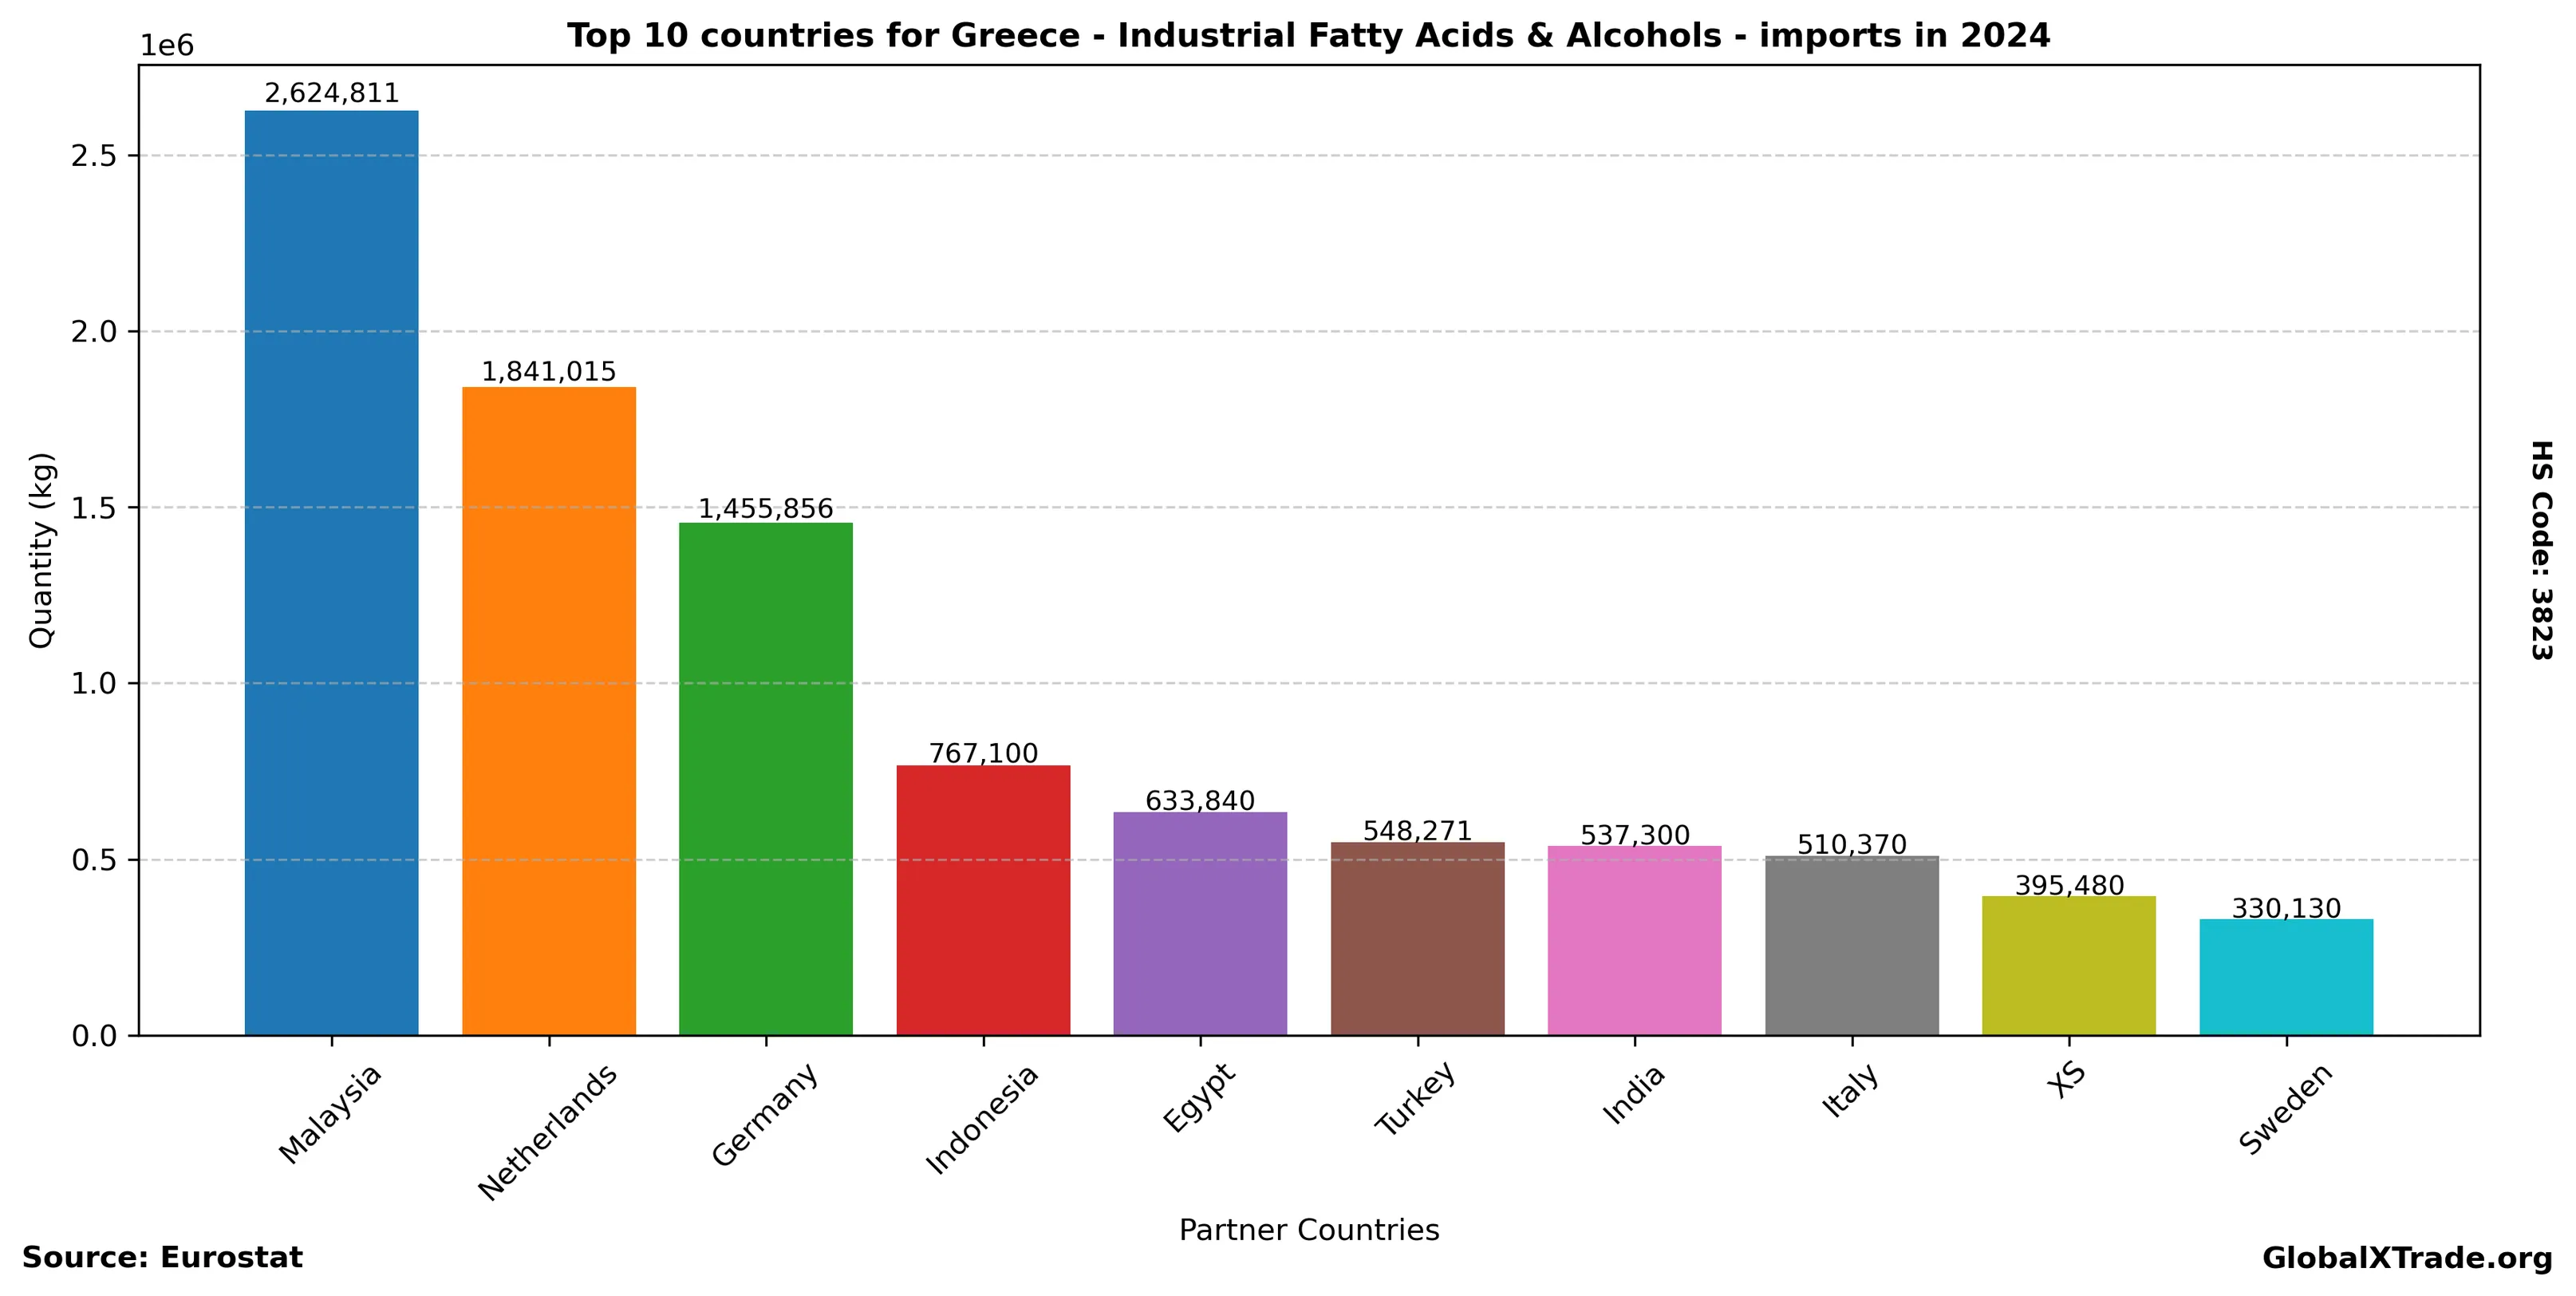
Top Partner Countries 2024
| partner | total_quantity_kg | total_value_eur |
|---|---|---|
| Malaysia | 2,624,811 | 3,720,976 |
| Netherlands | 1,841,015 | 3,117,813 |
| Germany | 1,455,856 | 2,708,872 |
| Indonesia | 767,100 | 1,090,183 |
| Egypt | 633,840 | 477,100 |
| Turkey | 548,271 | 646,109 |
| India | 537,300 | 834,799 |
| Italy | 510,370 | 1,046,941 |
| XS | 395,480 | 285,515 |
| Sweden | 330,130 | 862,914 |
Top Partner Countries 2023
| partner | total_quantity_kg | total_value_eur |
|---|---|---|
| Malaysia | 3,001,281 | 3,691,480 |
| Germany | 1,974,186 | 3,261,553 |
| Indonesia | 1,186,101 | 1,283,698 |
| Netherlands | 1,140,375 | 1,574,388 |
| Bulgaria | 1,094,208 | 795,591 |
| Denmark | 743,830 | 251,218 |
| India | 670,227 | 959,133 |
| Spain | 605,731 | 1,424,096 |
| Turkey | 447,623 | 699,825 |
| Italy | 323,383 | 595,420 |