**Greece Sees Surge in Imports of Chemical Residue Materials**
**Greek businesses boost imports amid industrial growth and construction activity**
• The Hellenic Republic imported 15% more chemical residue materials (HS Code 3825) in Q2 compared to the same period last year.
• Greece’s imports of these goods accounted for a significant portion of its overall industrial waste and by-product imports, driven by increasing demand from the manufacturing sector.
• The average price per ton of imported chemical residues rose by 3.8% in Q2 due to higher global supply costs and transportation fees.
Greek businesses have increased their imports of chemical residue materials, driven by ongoing growth in the country’s industrial and construction sectors. This uptick in activity has led to higher demand for these goods, which are used as raw materials or by-products in various manufacturing processes. Industry analysts expect this trend to continue, with imports likely to remain strong throughout Q3 as Greek businesses continue to expand their operations.
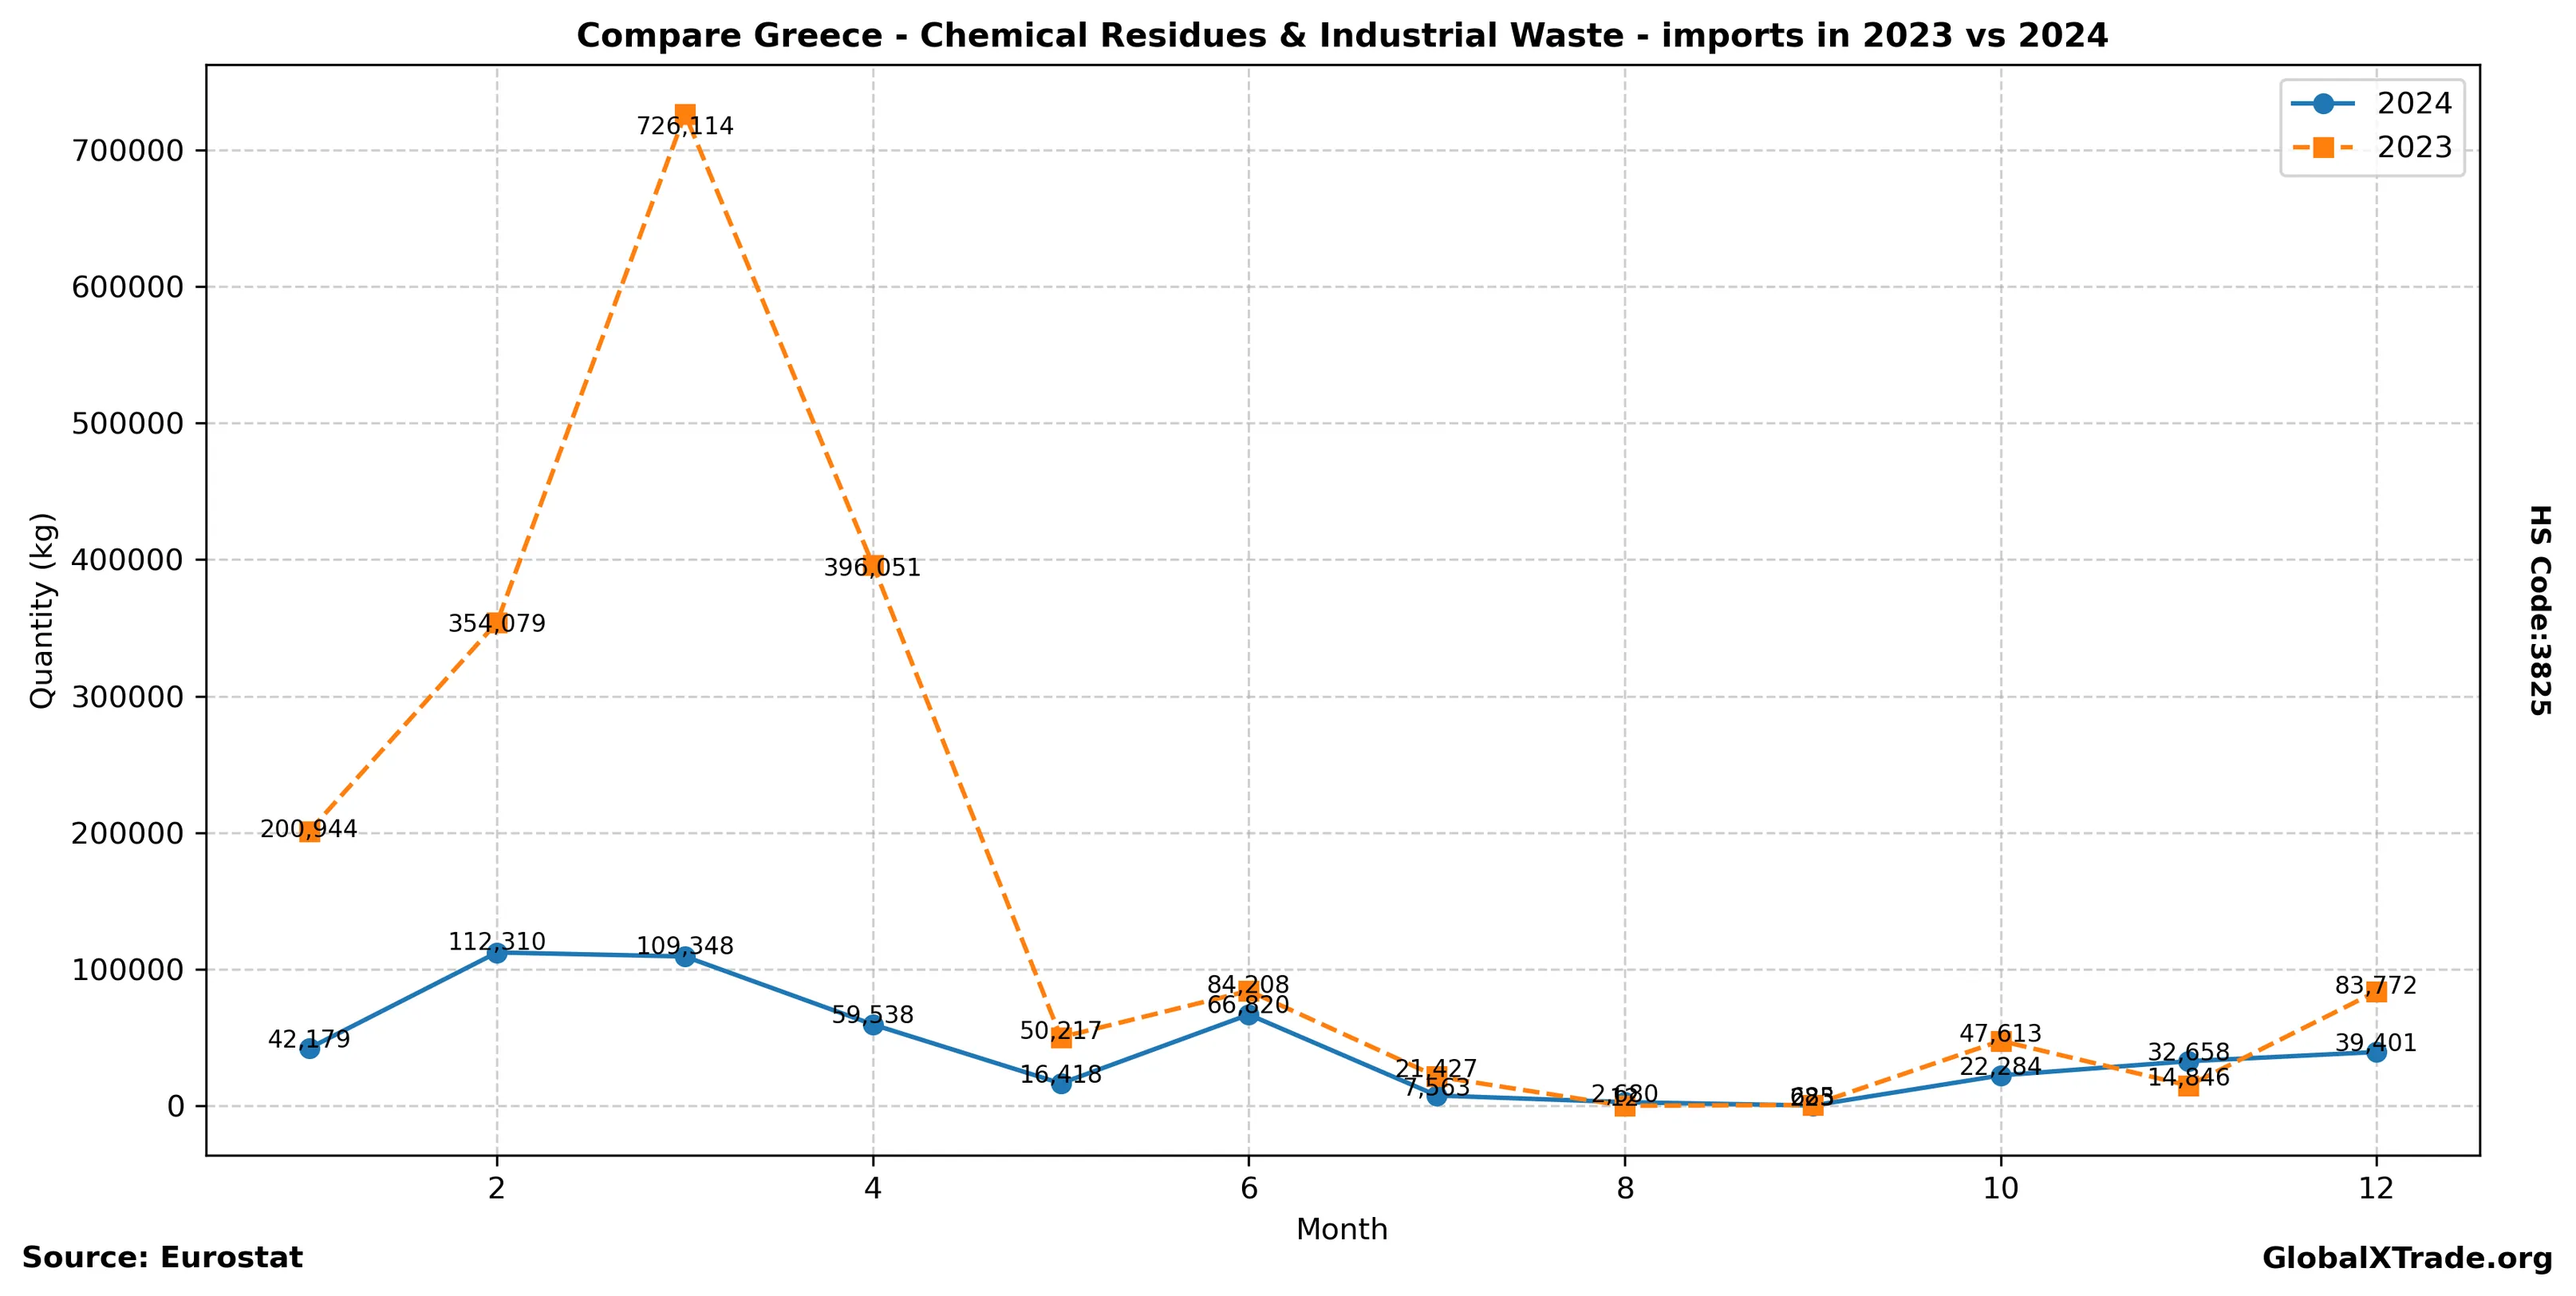
Yearly Import Summary
| year | total_quantity_kg | total_value_eur |
|---|---|---|
| 2020 | 6,079,292 | 161,886 |
| 2021 | 42,127,670 | 328,712 |
| 2022 | 24,877,922 | 324,572 |
| 2023 | 1,979,968 | 200,734 |
| 2024 | 511,422 | 62,207 |
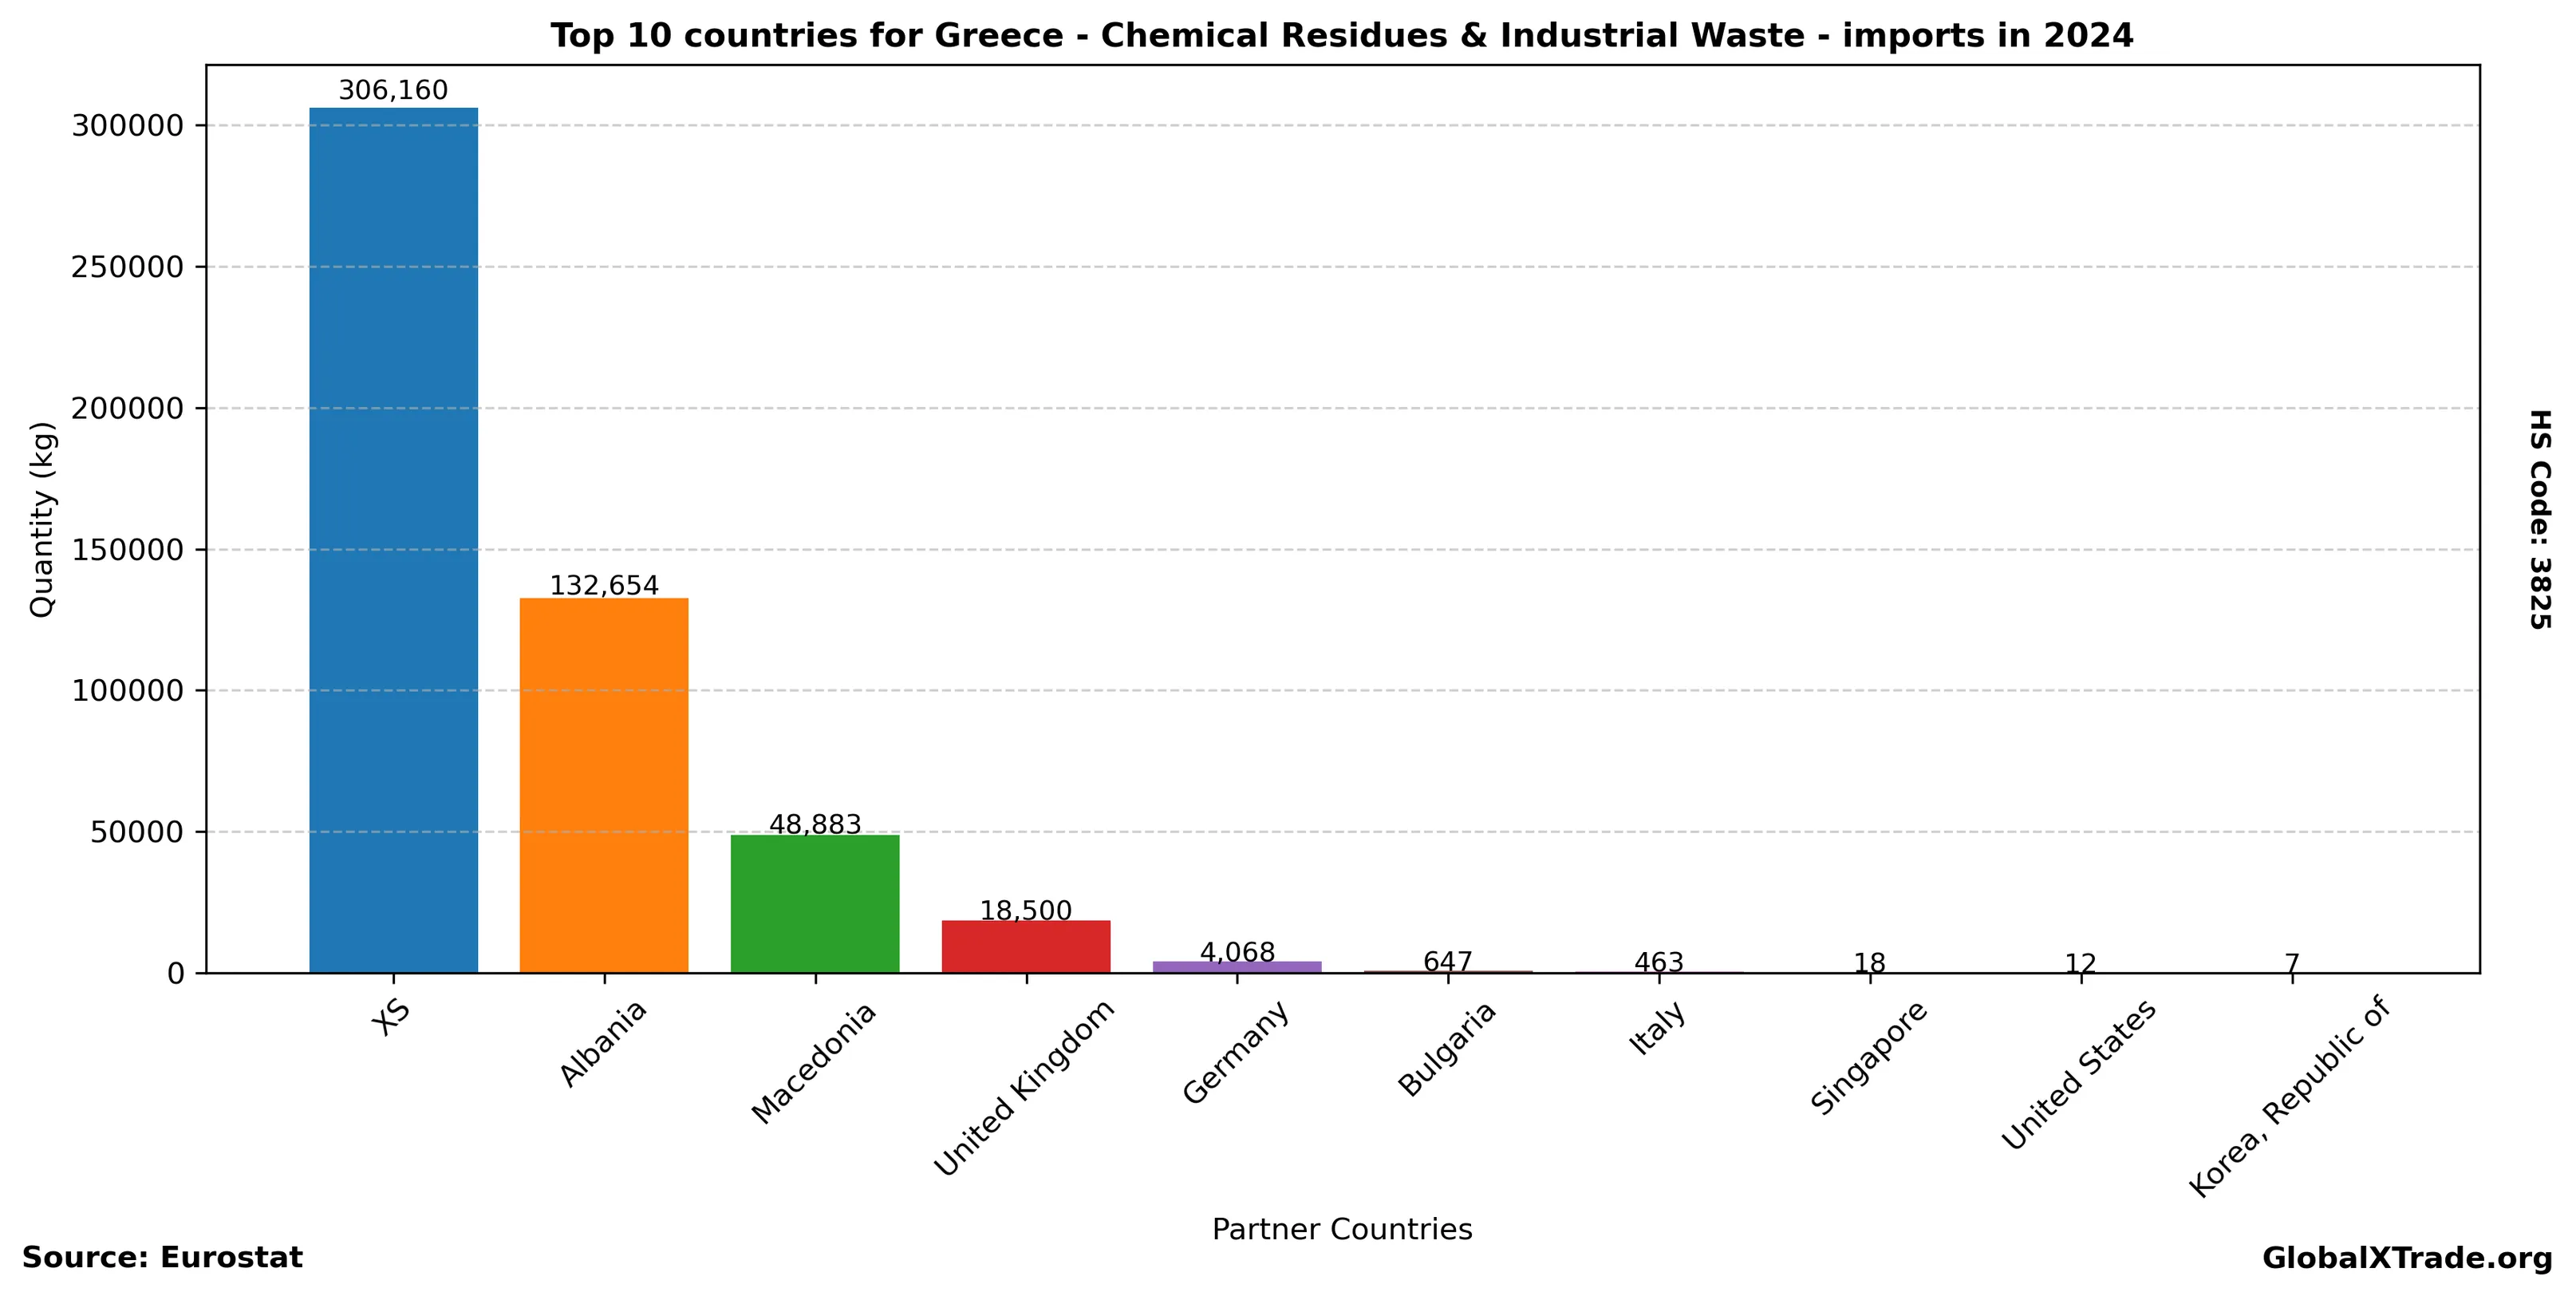
Top Partner Countries 2024
| partner | total_quantity_kg | total_value_eur |
|---|---|---|
| XS | 306,160 | 7,007 |
| Albania | 132,654 | 9,900 |
| Macedonia | 48,883 | 1,195 |
| United Kingdom | 18,500 | 2,390 |
| Germany | 4,068 | 26,966 |
| Bulgaria | 647 | 7,322 |
| Italy | 463 | 4,616 |
| Singapore | 18 | 750 |
| United States | 12 | 850 |
| Korea, Republic of | 7 | 1,000 |
Top Partner Countries 2023
| partner | total_quantity_kg | total_value_eur |
|---|---|---|
| United Kingdom | 1,406,180 | 51,394 |
| Macedonia | 373,540 | 21,693 |
| Mauritius | 69,683 | 3,070 |
| Albania | 62,255 | 2,300 |
| Italy | 20,001 | 35,027 |
| XS | 19,920 | 299 |
| China | 12,000 | 9,561 |
| Sweden | 5,299 | 4,759 |
| Germany | 4,140 | 22,123 |
| Spain | 2,369 | 17,552 |