**Greek Imports of Plastic Sanitary Ware Rise Slightly in Q2**
**Increased demand from construction sector drives modest growth**
• Greek imports of plastic sanitary ware rose by 4.5% to 12,500 units in the second quarter.
• The increase is attributed to a pick-up in construction activity, driven by government stimulus packages and EU investment projects.
• Prices for plastic sanitary ware remained stable at an average of €20 per unit, reflecting a balanced supply-demand dynamic.
Greek imports of plastic sanitary ware have shown a modest rebound in the second quarter, driven by increased demand from the construction sector. The rise is attributed to a pick-up in construction activity, as government stimulus packages and EU investment projects boost infrastructure spending. Prices for plastic sanitary ware remain stable, indicating a balanced market dynamic. However, industry experts caution that this growth may be short-lived due to ongoing supply chain disruptions.
Yearly Import Summary
| year | total_quantity_kg | total_value_eur |
|---|---|---|
| 2020 | 3,754,699 | 16,722,707 |
| 2021 | 5,074,198 | 24,652,147 |
| 2022 | 5,011,839 | 25,827,155 |
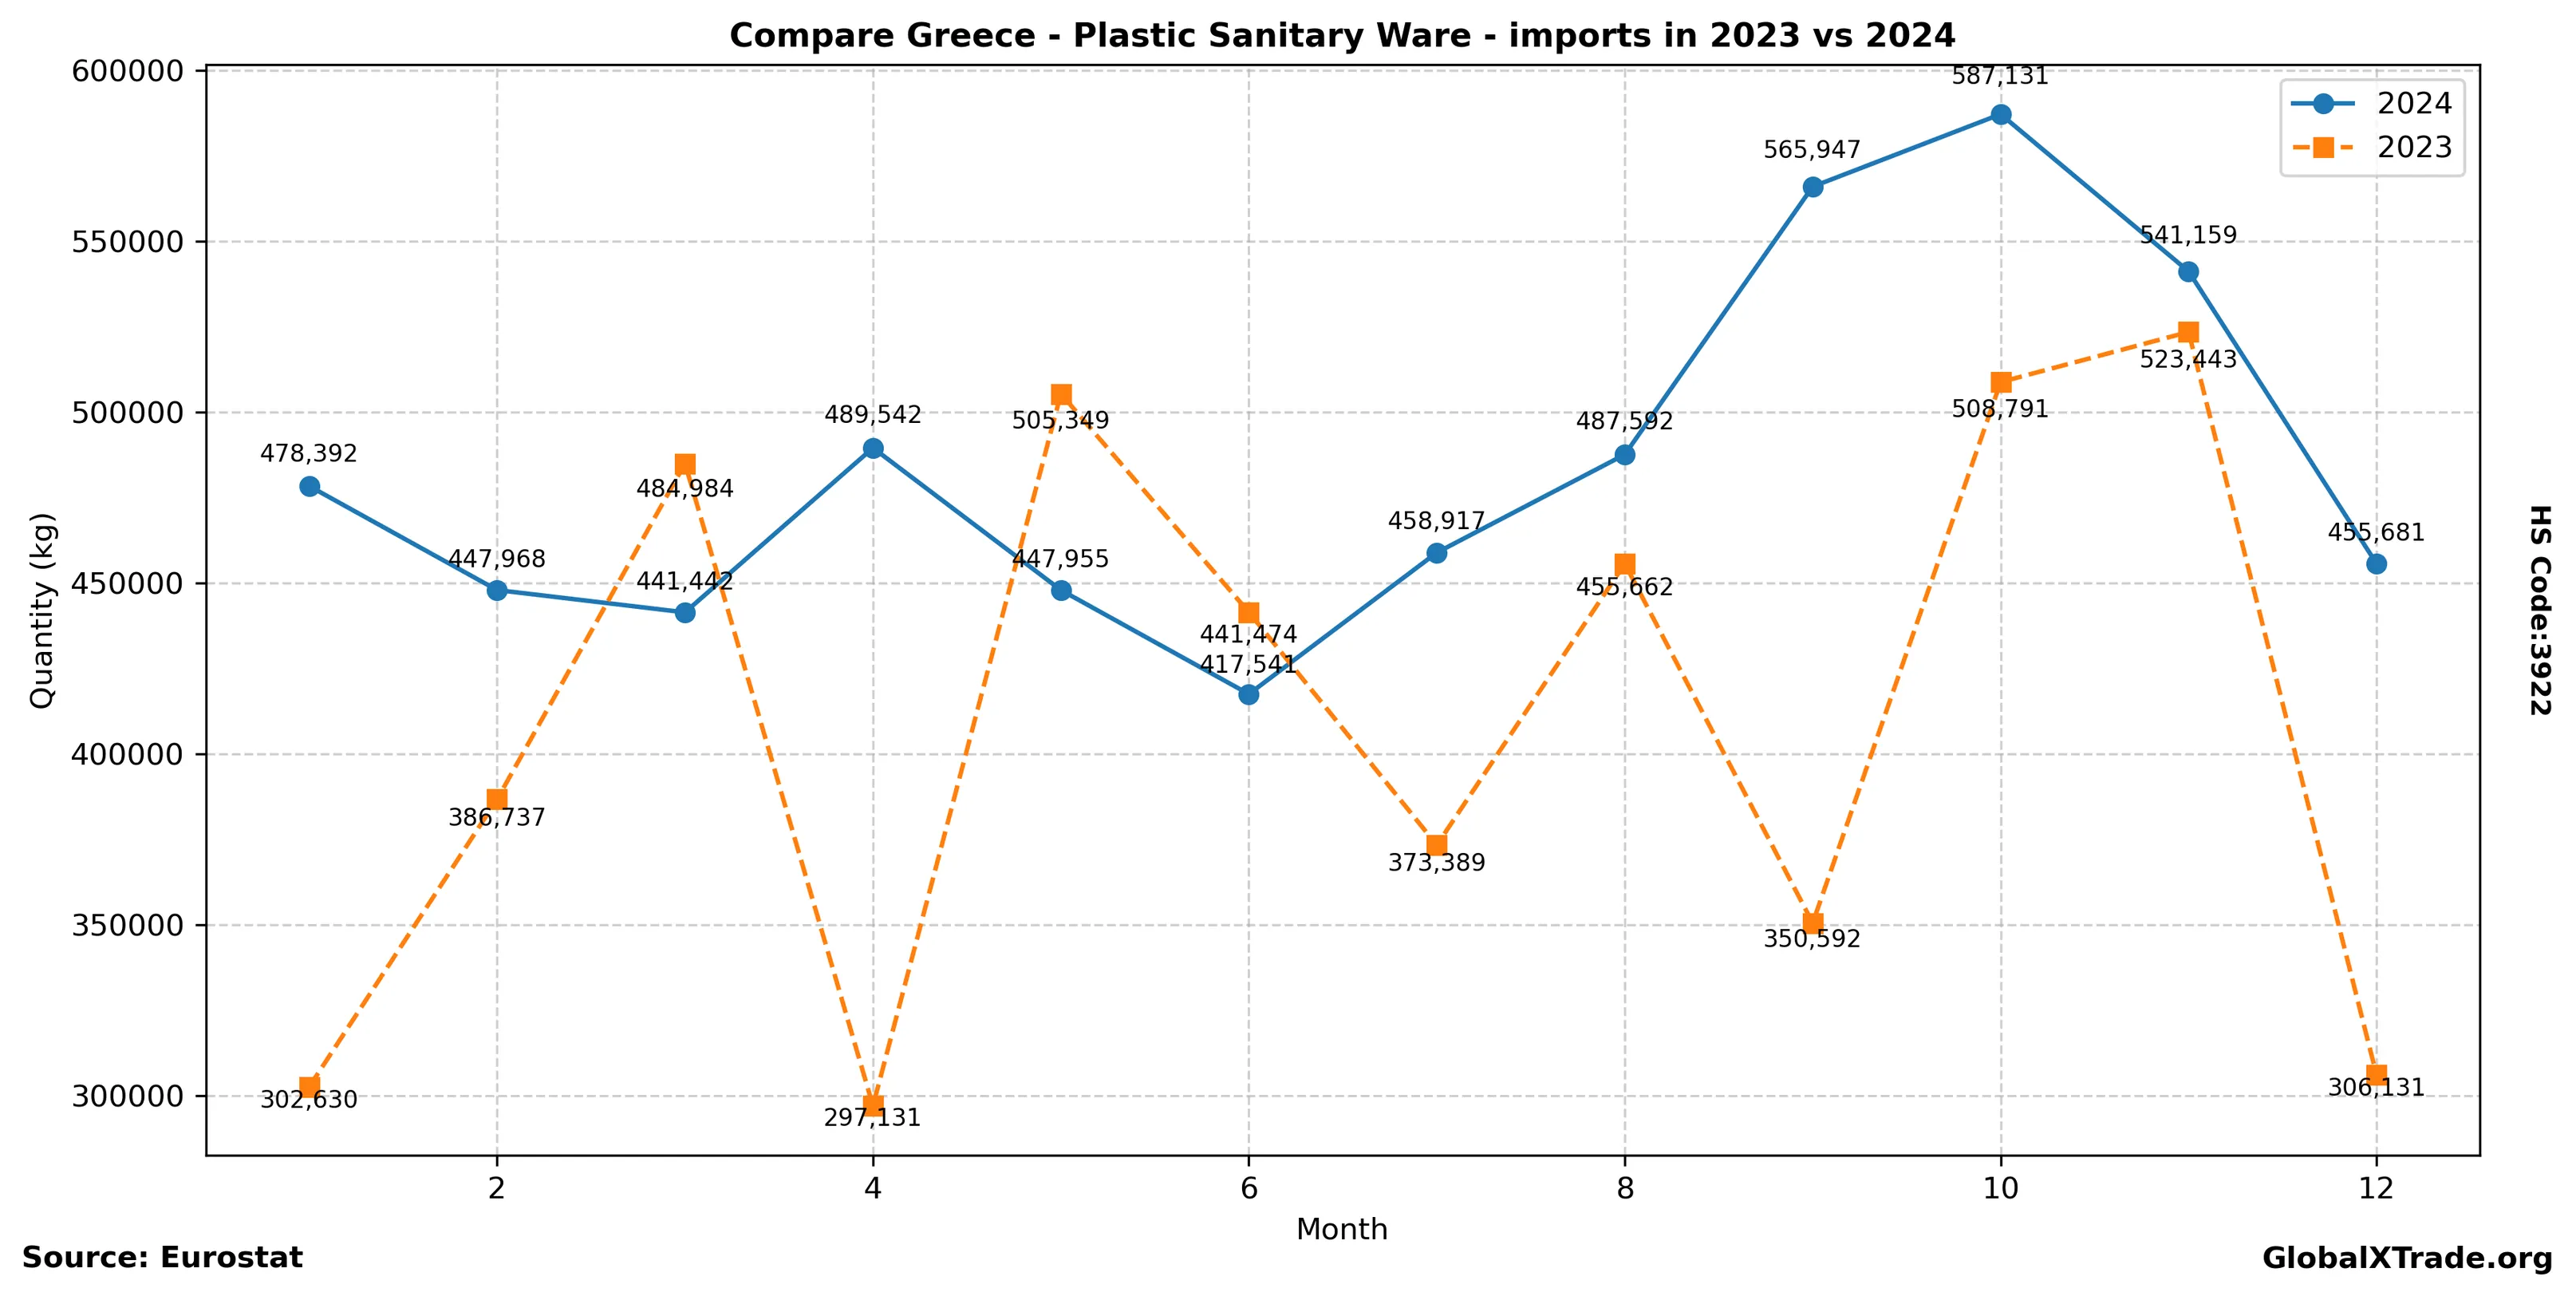
| 2023 | 4,936,313 | 26,672,395 |
| 2024 | 5,819,267 | 31,433,381 |
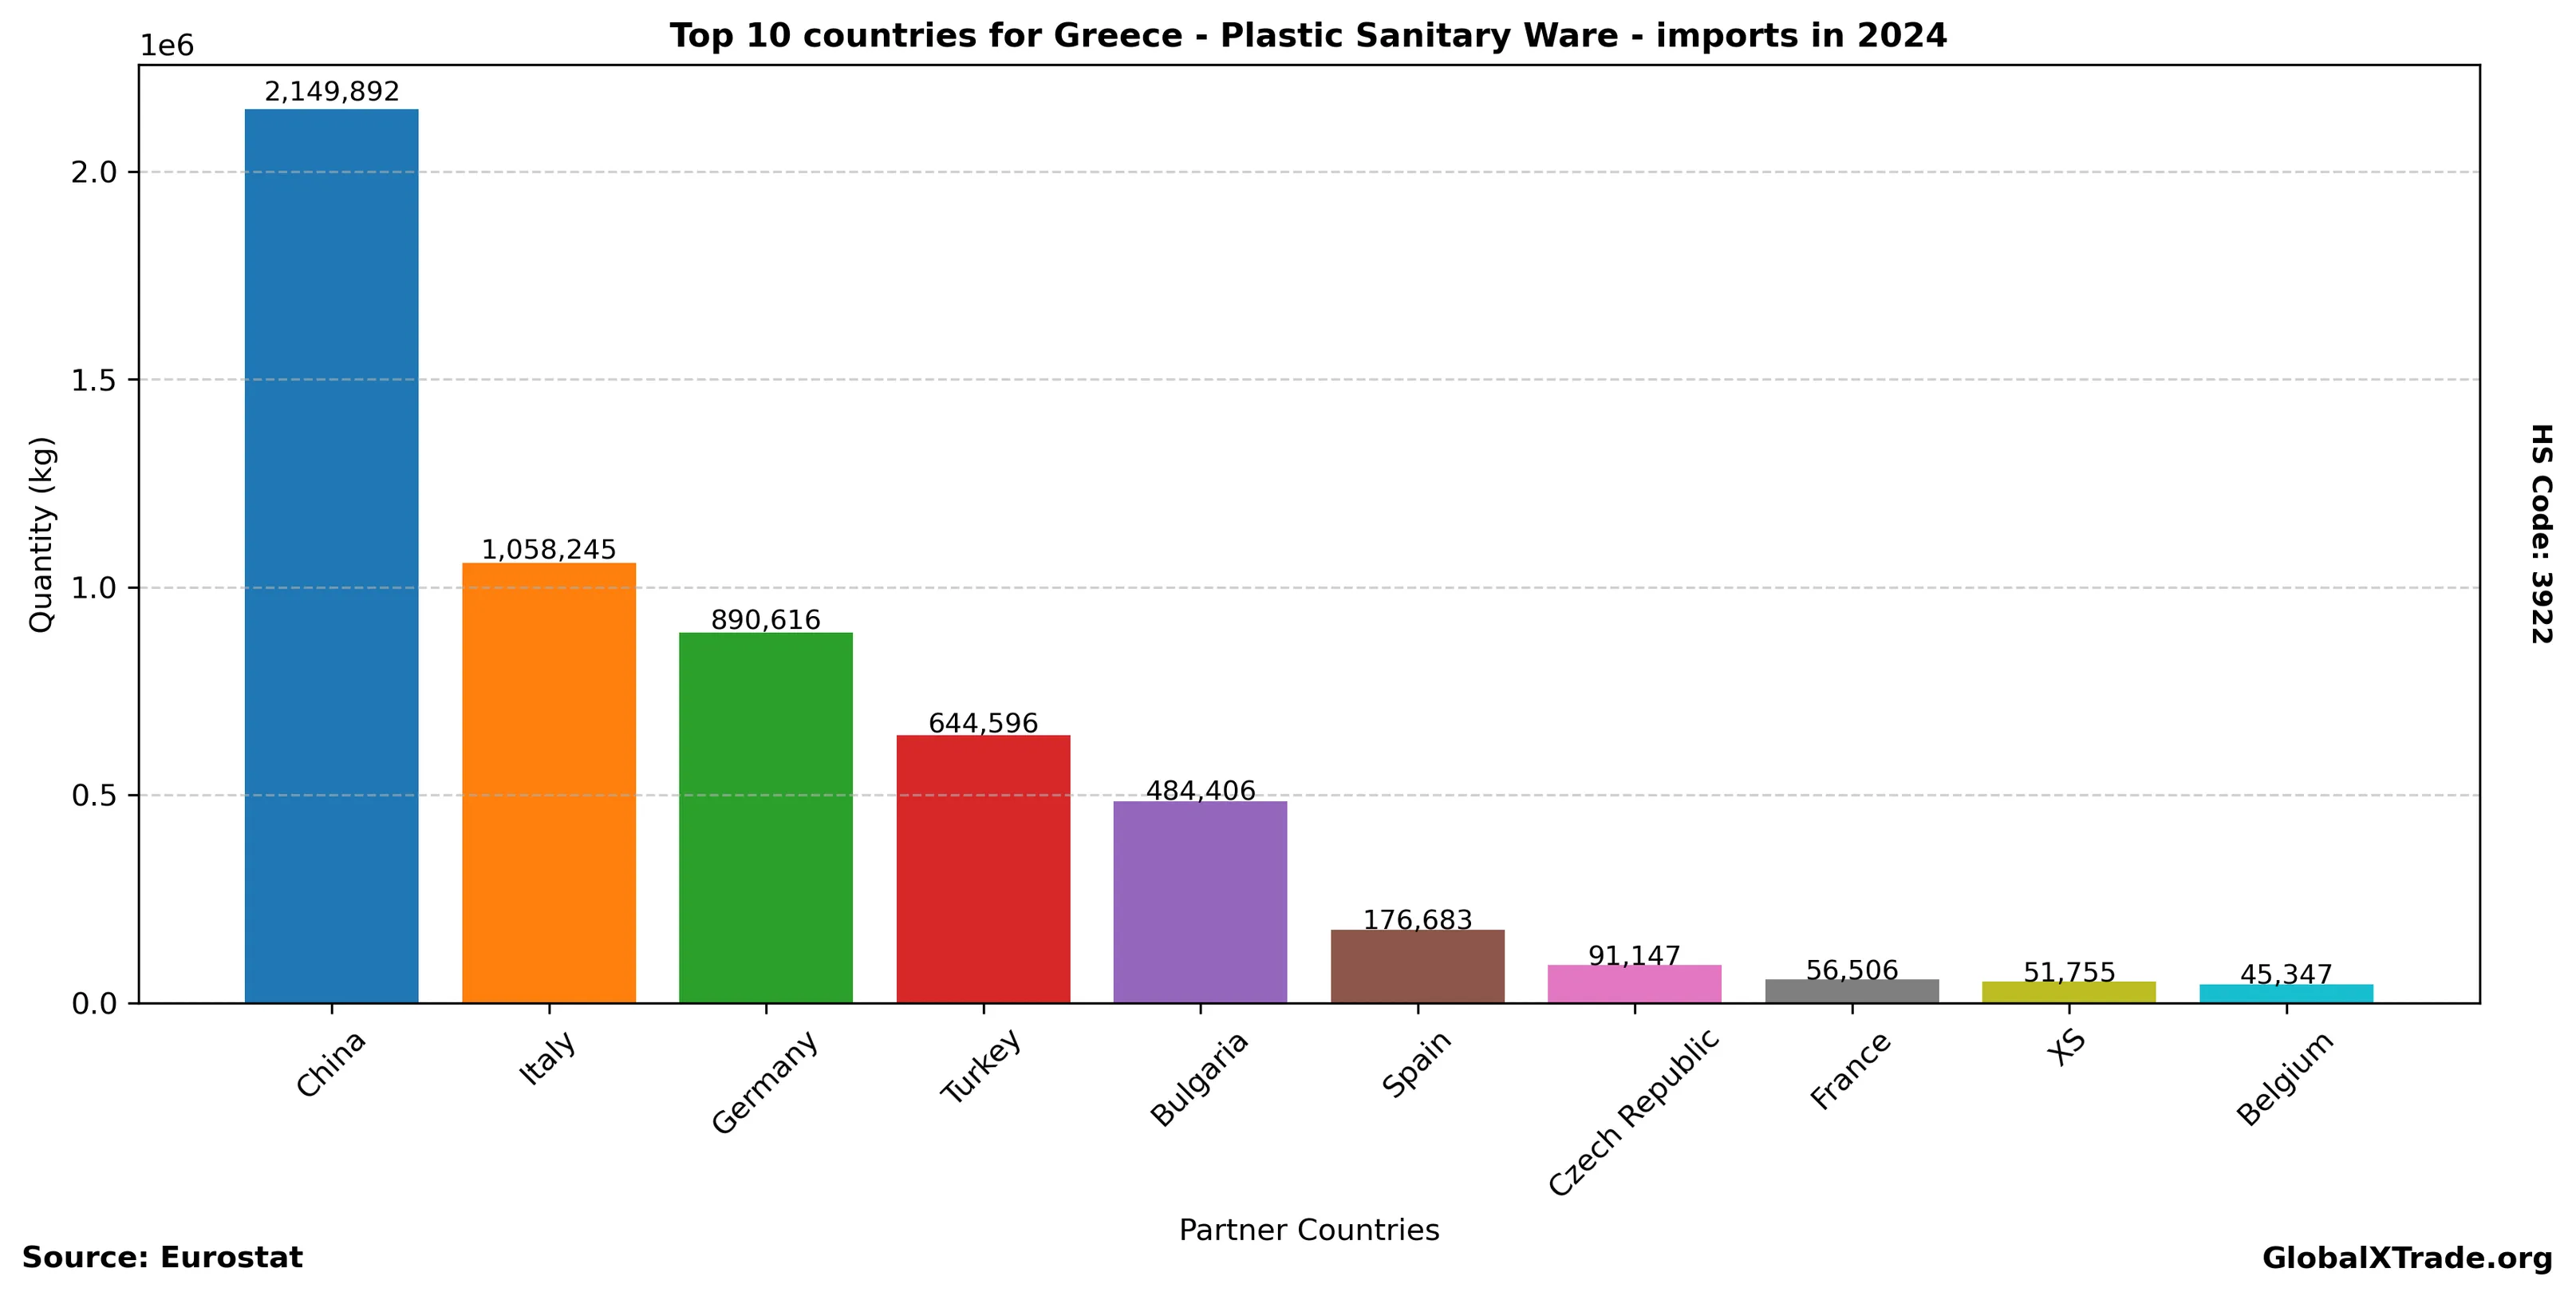
Top Partner Countries 2024
| partner | total_quantity_kg | total_value_eur |
|---|---|---|
| China | 2,149,892 | 5,680,316 |
| Italy | 1,058,245 | 6,807,958 |
| Germany | 890,616 | 9,025,678 |
| Turkey | 644,596 | 3,159,019 |
| Bulgaria | 484,406 | 2,888,505 |
| Spain | 176,683 | 656,862 |
| Czech Republic | 91,147 | 605,453 |
| France | 56,506 | 468,293 |
| XS | 51,755 | 325,377 |
| Belgium | 45,347 | 185,478 |
Top Partner Countries 2023
| partner | total_quantity_kg | total_value_eur |
|---|---|---|
| China | 1,779,621 | 4,760,595 |
| Italy | 1,086,478 | 6,723,309 |
| Germany | 618,663 | 6,210,457 |
| Turkey | 526,167 | 2,877,599 |
| Bulgaria | 378,705 | 2,420,355 |
| Spain | 150,240 | 367,988 |
| Czech Republic | 70,498 | 712,645 |
| XS | 53,694 | 392,940 |
| United Kingdom | 46,913 | 337,860 |
| Egypt | 39,060 | 145,067 |