**Greek Imports of Artificial and Prepared Waxes Surge in Q2**
**Rising Demand for Cosmetics Boosts Greek Import Volumes**
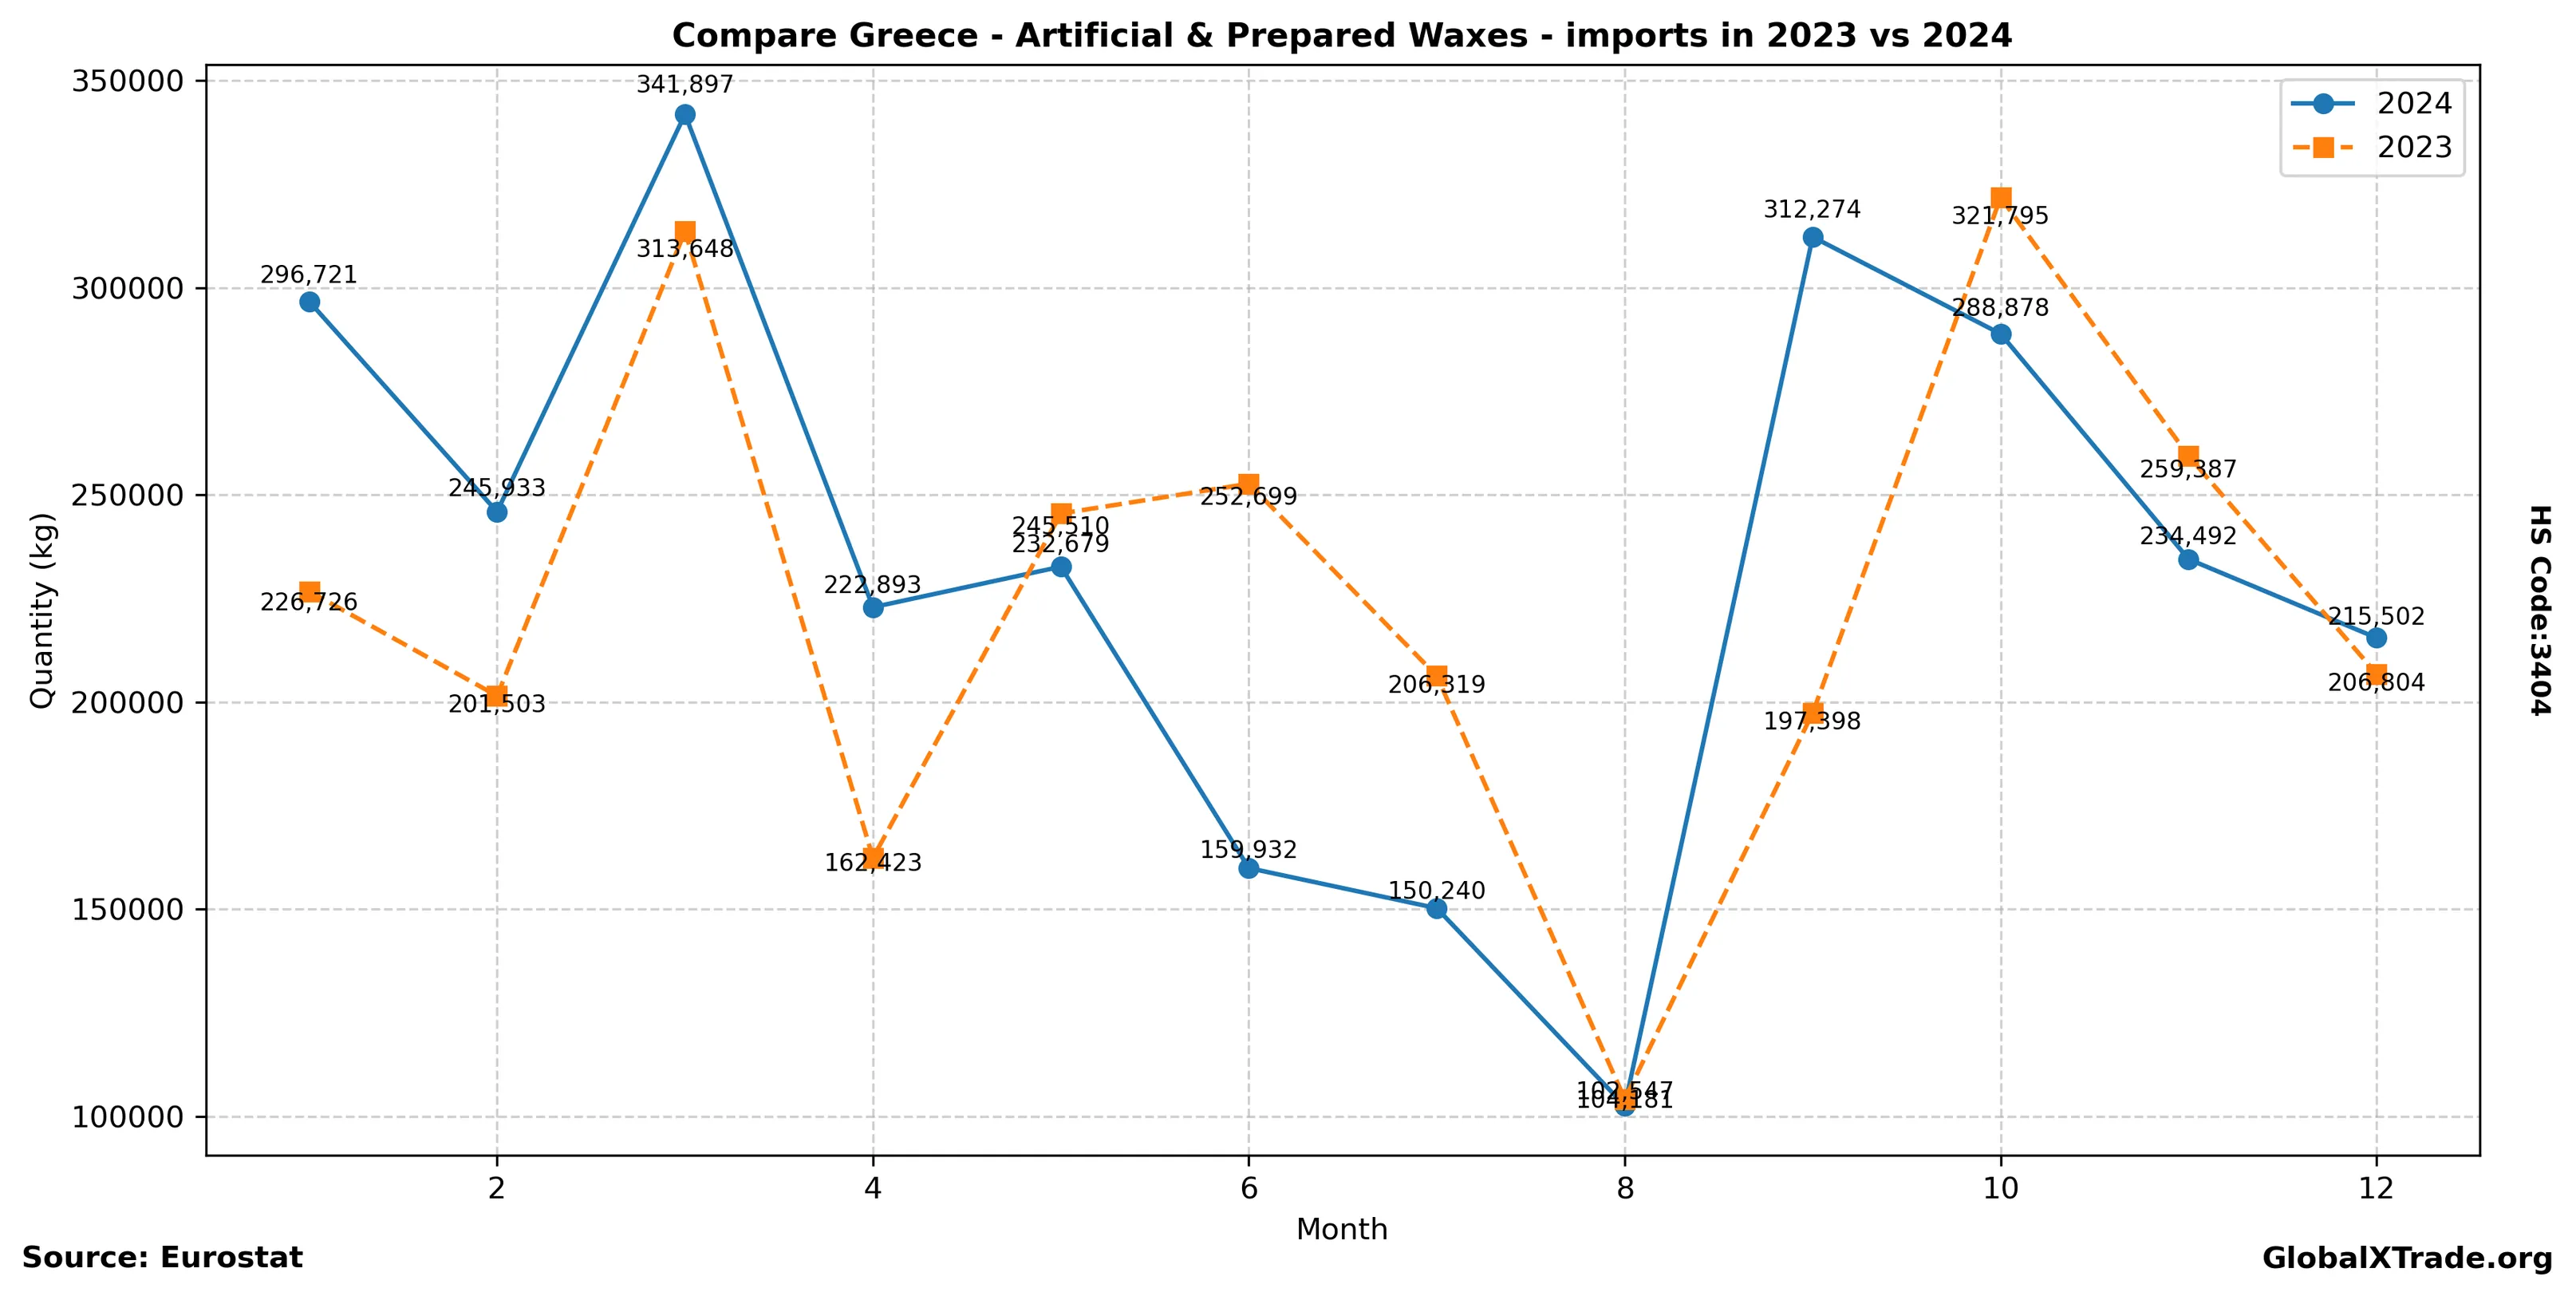
• Greek imports of artificial and prepared waxes (HS Code 3404) rose by 12.3% year-over-year to 22,500 metric tons in the second quarter.
• The increase is attributed to a rebound in the cosmetics sector following the easing of COVID-19 restrictions, driving up demand for these essential ingredients.
• Prices of artificial and prepared waxes remained relatively stable during Q2, with average imports prices standing at €1.85 per kilogram, down 3.5% from the same period last year.
Greek importers are capitalizing on the renewed momentum in the cosmetics industry, with many major retailers increasing their stockpiles of artificial and prepared waxes to meet anticipated demand during the peak summer season. The trend is expected to continue into Q3, driven by strong consumer spending and a favorable economic outlook.
Yearly Import Summary
| year | total_quantity_kg | total_value_eur |
|---|---|---|
| 2020 | 2,964,738 | 7,181,840 |
| 2021 | 3,159,495 | 8,468,737 |
| 2022 | 3,330,631 | 12,872,223 |
| 2023 | 2,698,393 | 9,906,727 |
| 2024 | 2,803,988 | 10,730,602 |
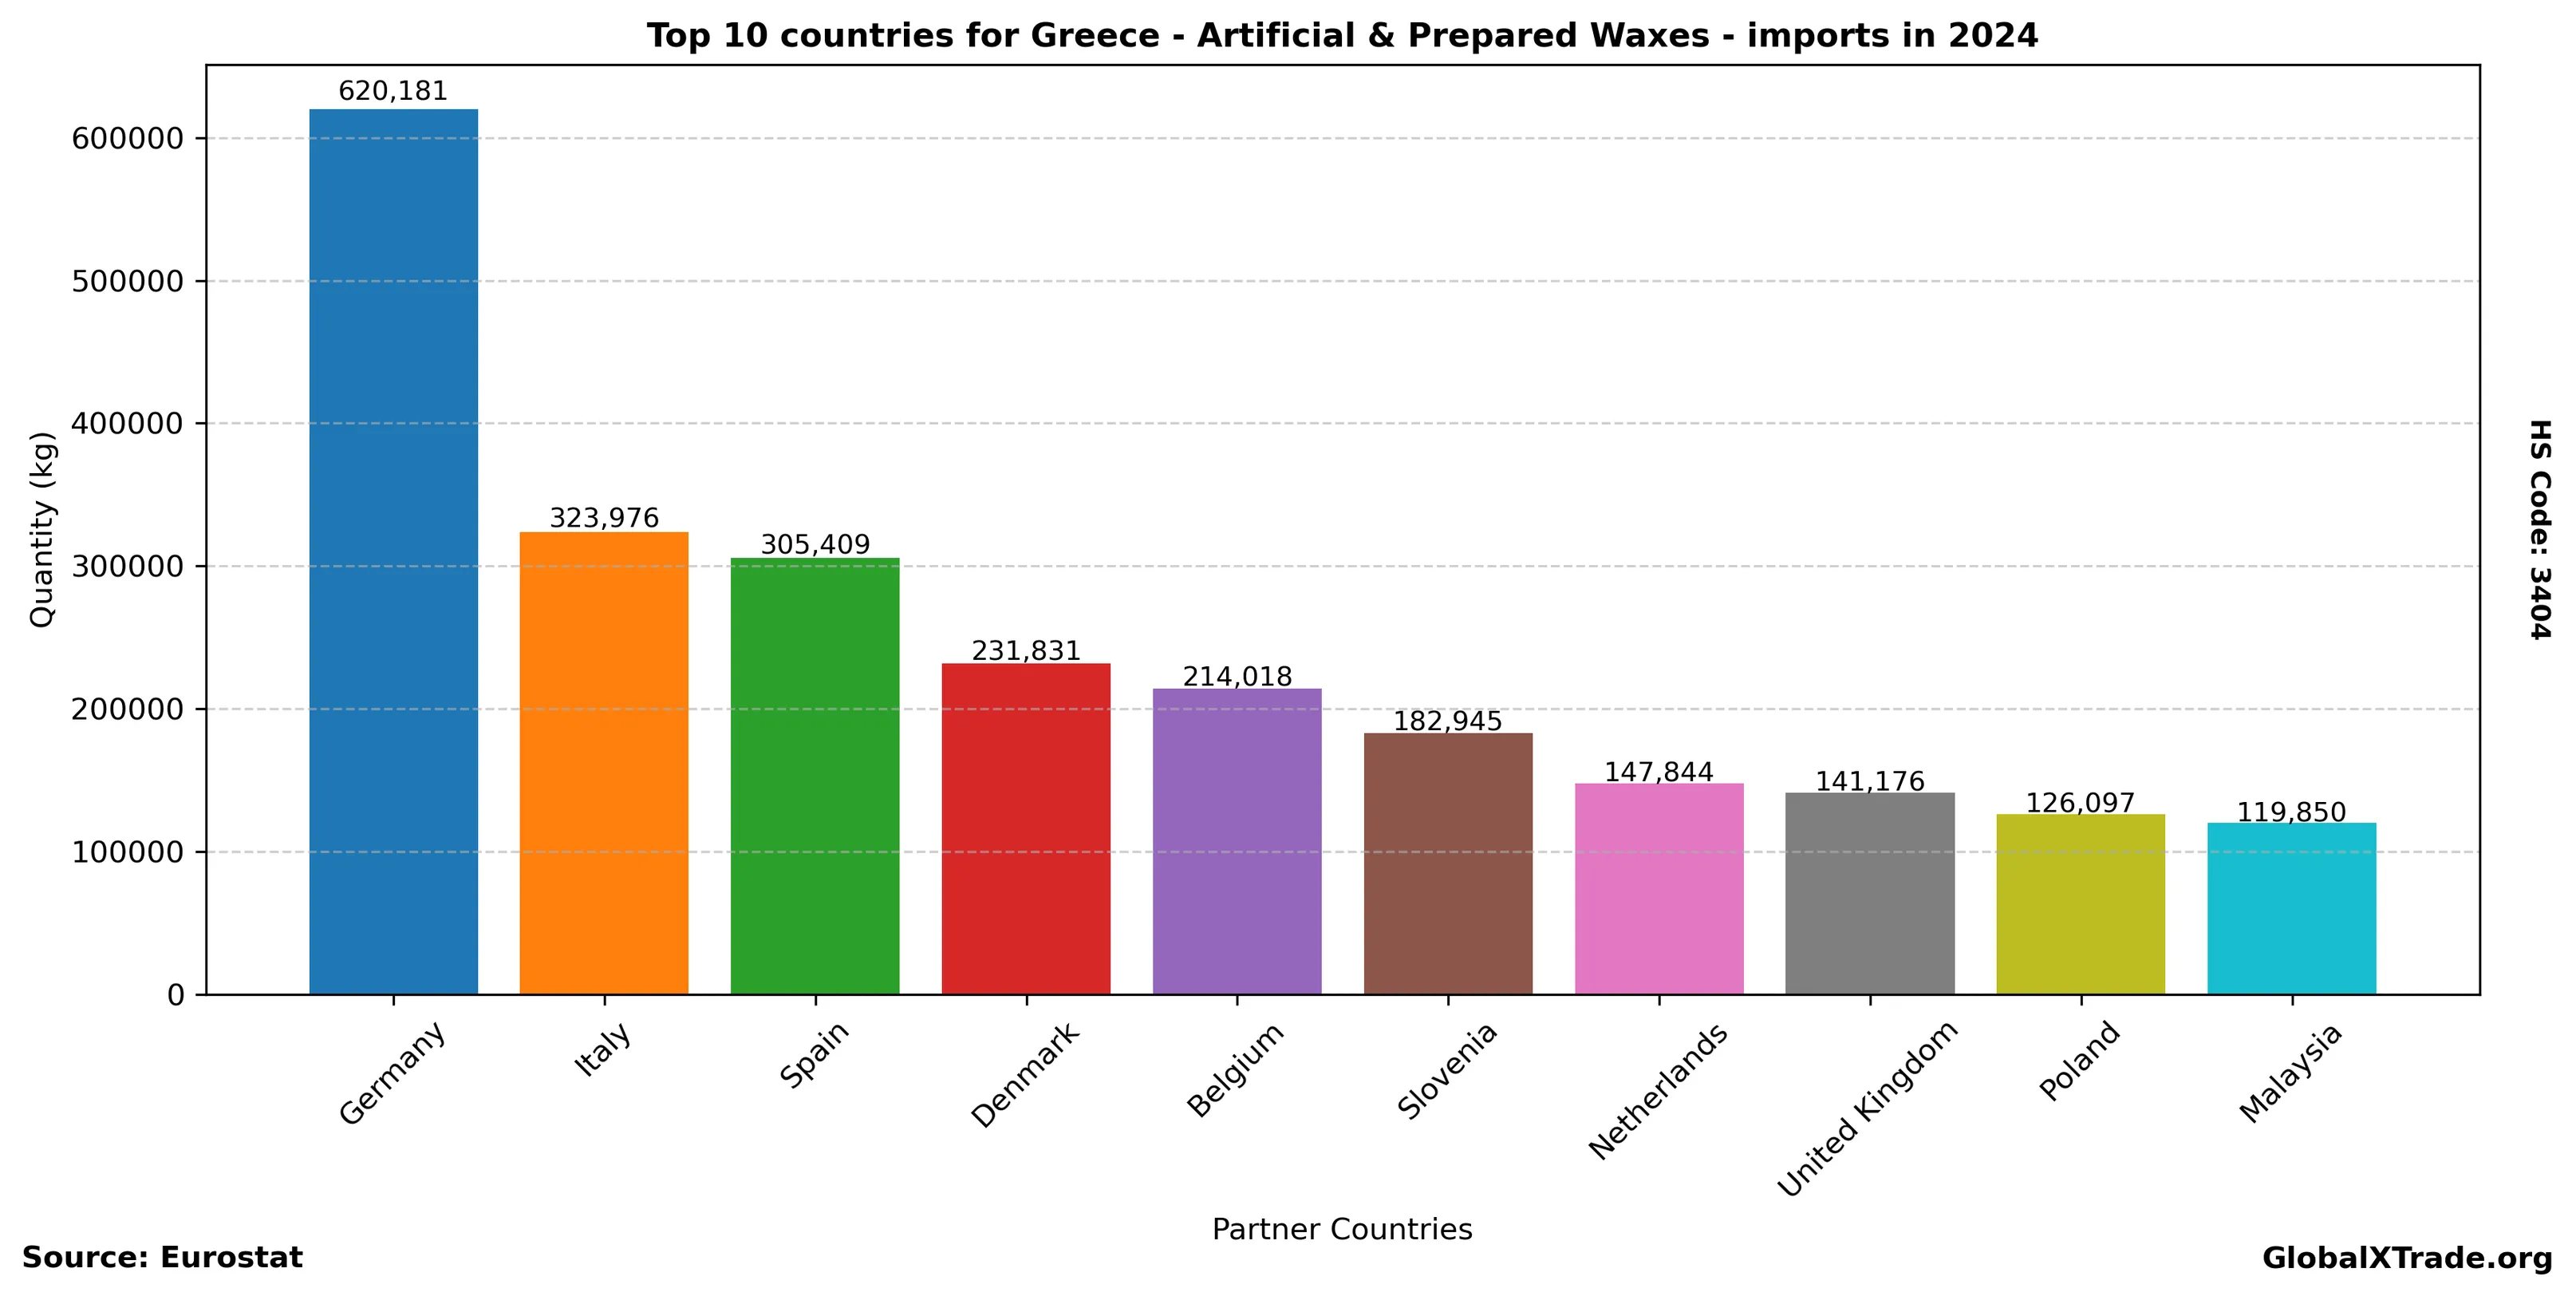
Top Partner Countries 2024
| partner | total_quantity_kg | total_value_eur |
|---|---|---|
| Germany | 620,181 | 2,933,364 |
| Italy | 323,976 | 1,070,395 |
| Spain | 305,409 | 806,949 |
| Denmark | 231,831 | 672,657 |
| Belgium | 214,018 | 925,911 |
| Slovenia | 182,945 | 713,328 |
| Netherlands | 147,844 | 867,717 |
| United Kingdom | 141,176 | 650,029 |
| Poland | 126,097 | 259,092 |
| Malaysia | 119,850 | 274,892 |
Top Partner Countries 2023
| partner | total_quantity_kg | total_value_eur |
|---|---|---|
| Germany | 626,736 | 2,602,361 |
| Italy | 364,160 | 1,019,529 |
| Denmark | 249,072 | 902,585 |
| Belgium | 185,012 | 620,632 |
| Spain | 164,922 | 771,626 |
| Netherlands | 164,559 | 809,999 |
| Slovenia | 161,112 | 560,908 |
| Malaysia | 144,700 | 360,297 |
| Poland | 126,317 | 258,643 |
| China | 101,429 | 252,970 |