**Greek Imports of Graphite Products Rise Amid Strong Demand**
**Increased demand from Greek industries drives imports growth in Q2**
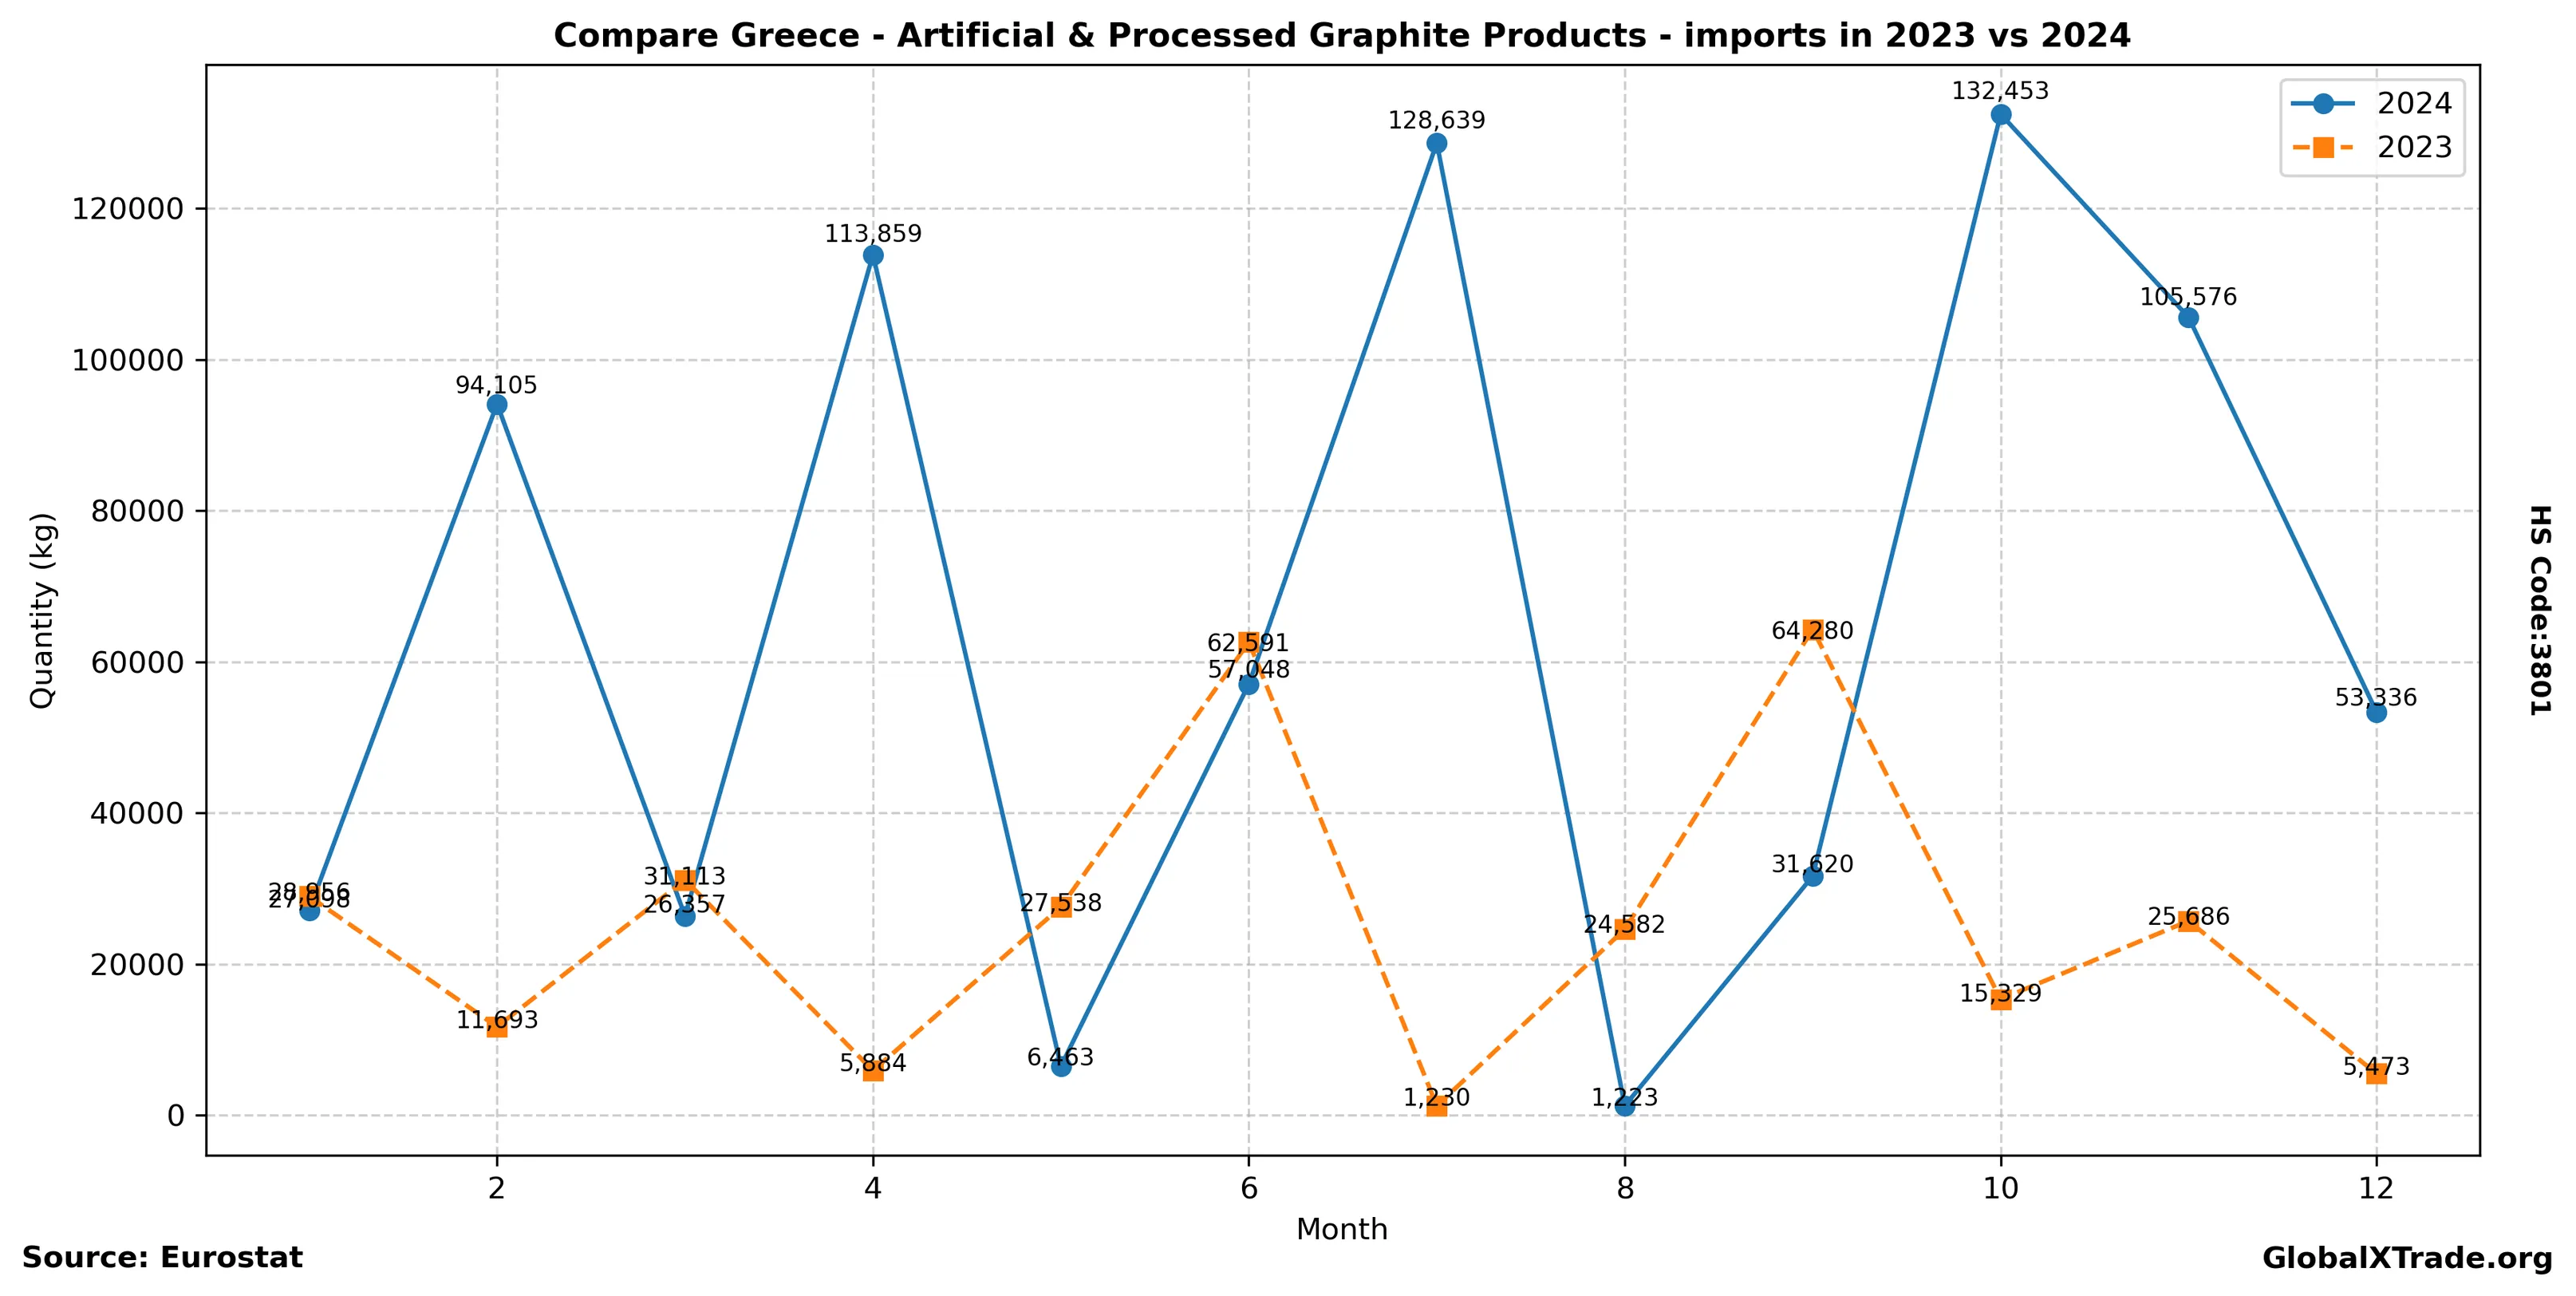
• Greek imports of artificial and processed graphite products surged 15% year-over-year in the second quarter.
• The increase was largely driven by strong demand from Greece’s automotive and electronics sectors, which accounted for over half of total imports.
• Prices for graphite products rose 5% during the same period due to supply chain disruptions and increased global demand.
Greek imports of artificial and processed graphite products accelerated in the second quarter, driven by a surge in demand from the country’s key industries. As Greece’s automotive and electronics sectors continue to expand, their reliance on graphite products has grown significantly. This trend is expected to persist in the coming quarters, with analysts predicting further increases in Greek graphite imports.
Yearly Import Summary
| year | total_quantity_kg | total_value_eur |
|---|---|---|
| 2020 | 3,425,604 | 3,389,429 |
| 2021 | 3,091,486 | 3,783,673 |
| 2022 | 1,802,807 | 3,076,150 |
| 2023 | 304,355 | 961,084 |
| 2024 | 777,777 | 1,902,162 |
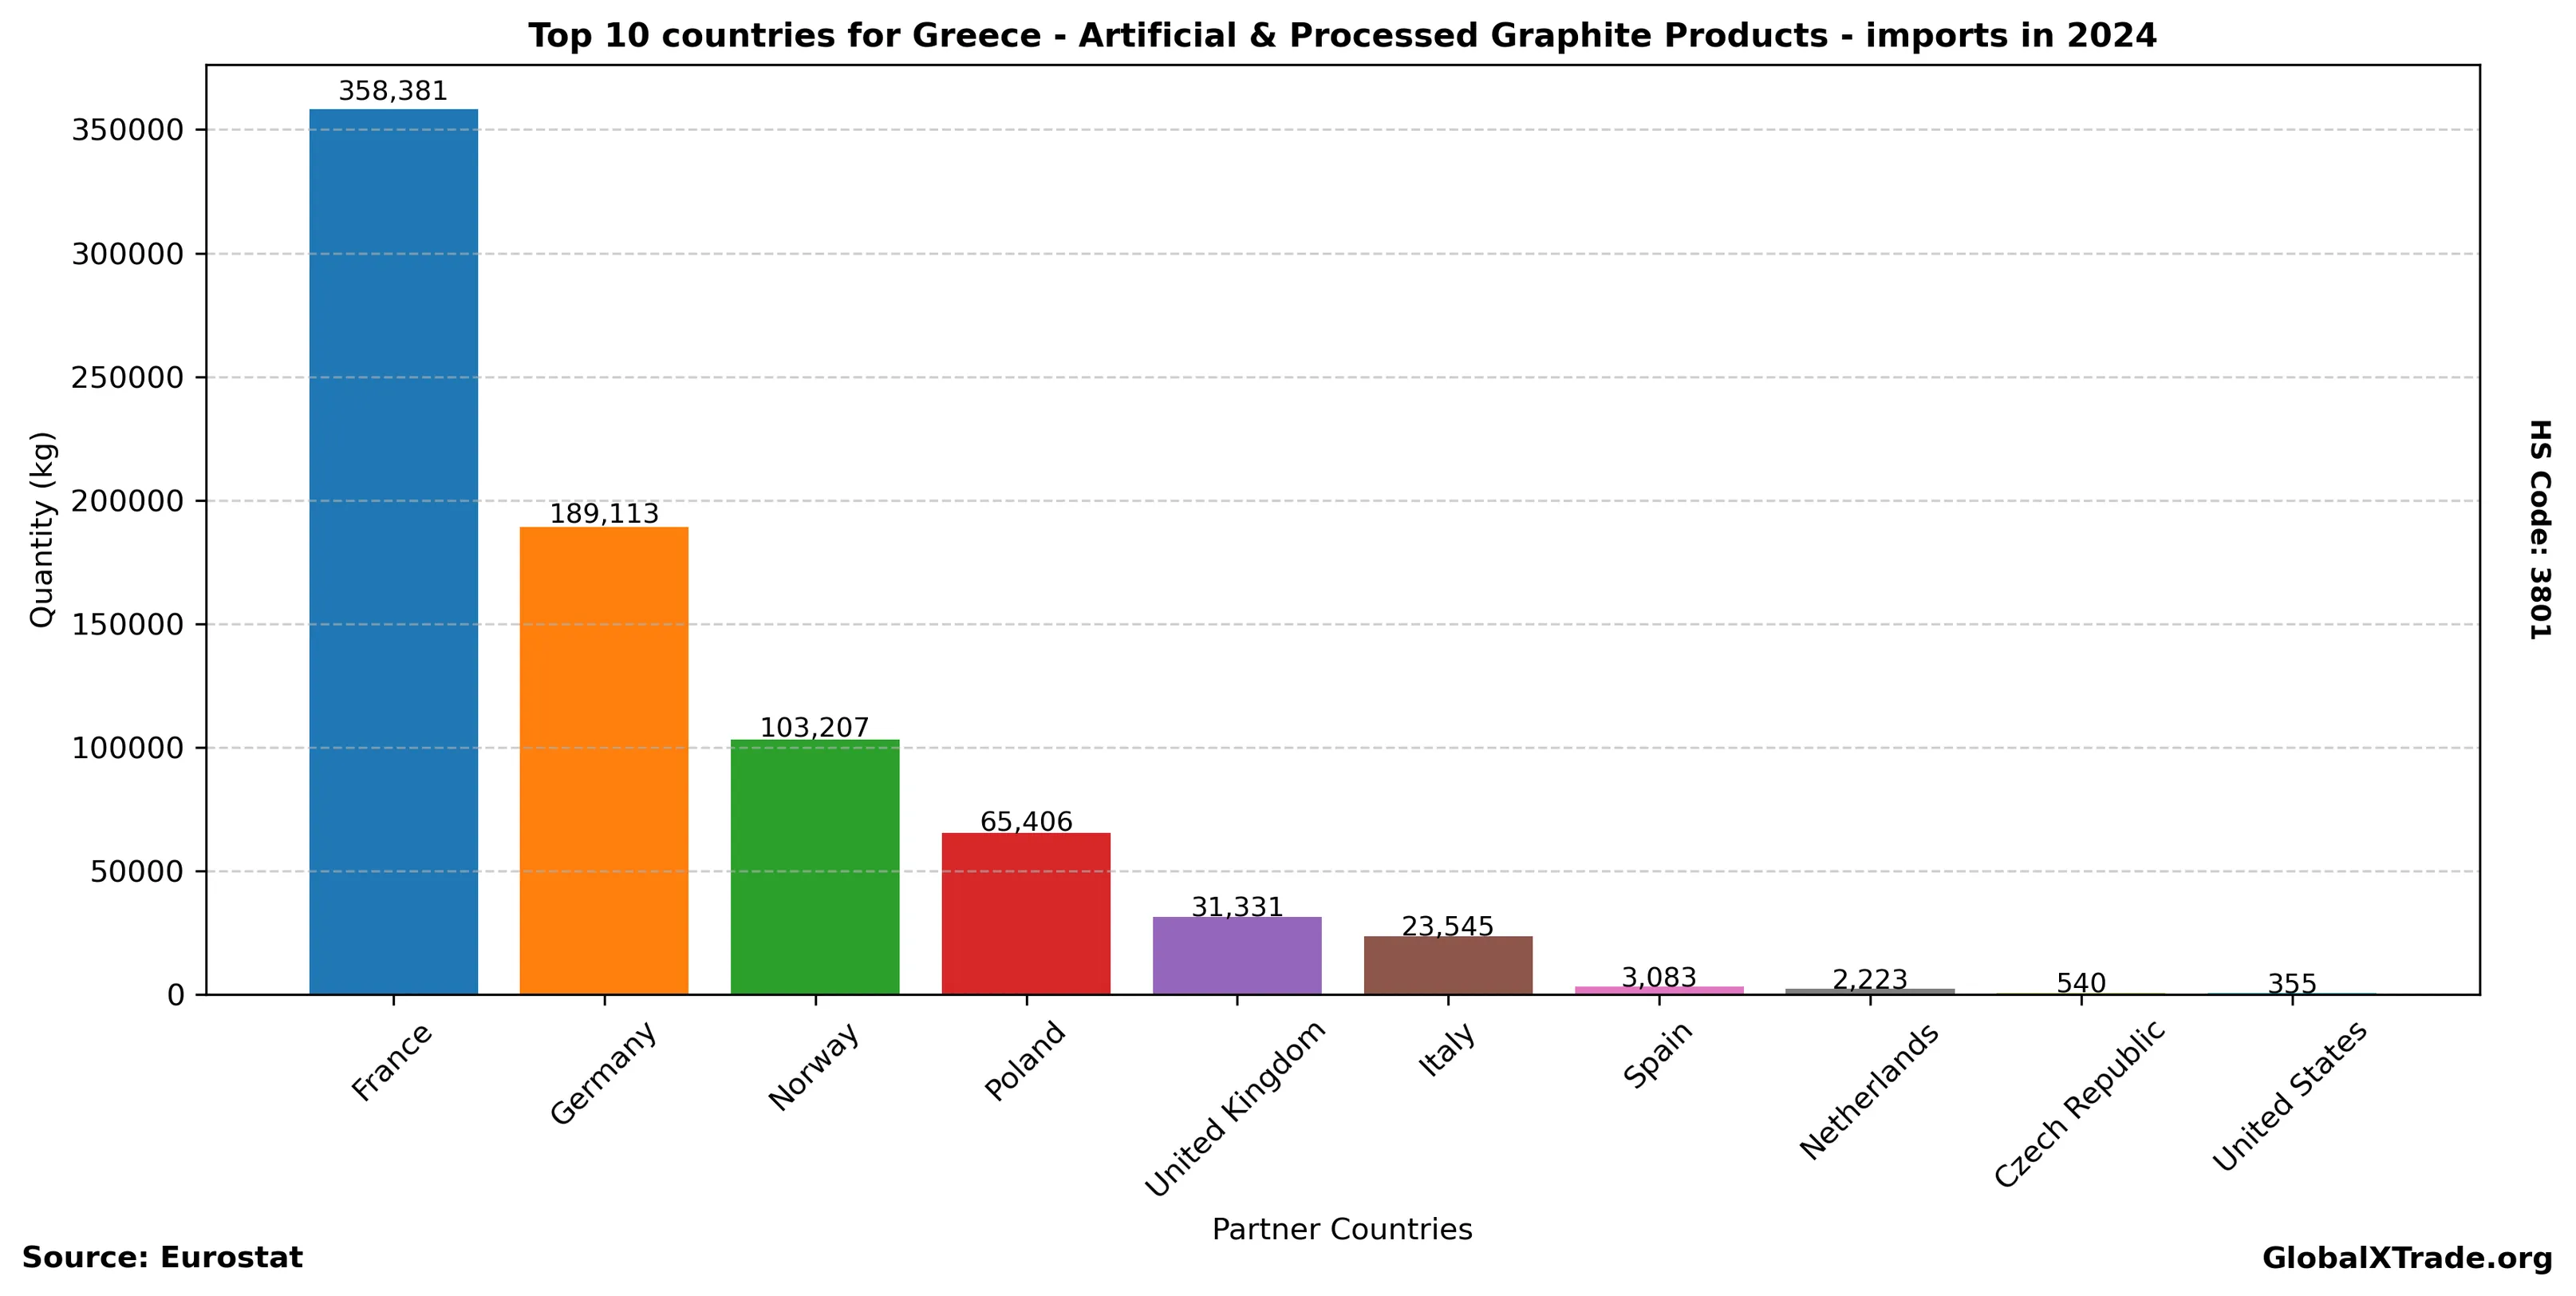
Top Partner Countries 2024
| partner | total_quantity_kg | total_value_eur |
|---|---|---|
| France | 358,381 | 777,428 |
| Germany | 189,113 | 376,559 |
| Norway | 103,207 | 203,271 |
| Poland | 65,406 | 144,797 |
| United Kingdom | 31,331 | 49,489 |
| Italy | 23,545 | 205,851 |
| Spain | 3,083 | 68,467 |
| Netherlands | 2,223 | 27,097 |
| Czech Republic | 540 | 4,647 |
| United States | 355 | 20,878 |
Top Partner Countries 2023
| partner | total_quantity_kg | total_value_eur |
|---|---|---|
| Germany | 172,305 | 358,941 |
| United Kingdom | 50,232 | 90,608 |
| Italy | 38,326 | 130,379 |
| Norway | 21,889 | 53,116 |
| Netherlands | 7,389 | 73,060 |
| France | 6,964 | 152,258 |
| Turkey | 2,607 | 33,227 |
| Spain | 2,394 | 55,457 |
| China | 2,004 | 4,140 |
| United States | 71 | 4,630 |