**Greek Imports of Ferro-Cerium & Pyrophoric Alloys Rise Slightly**
**Ferrocerium demand boosted by European steel sector growth**
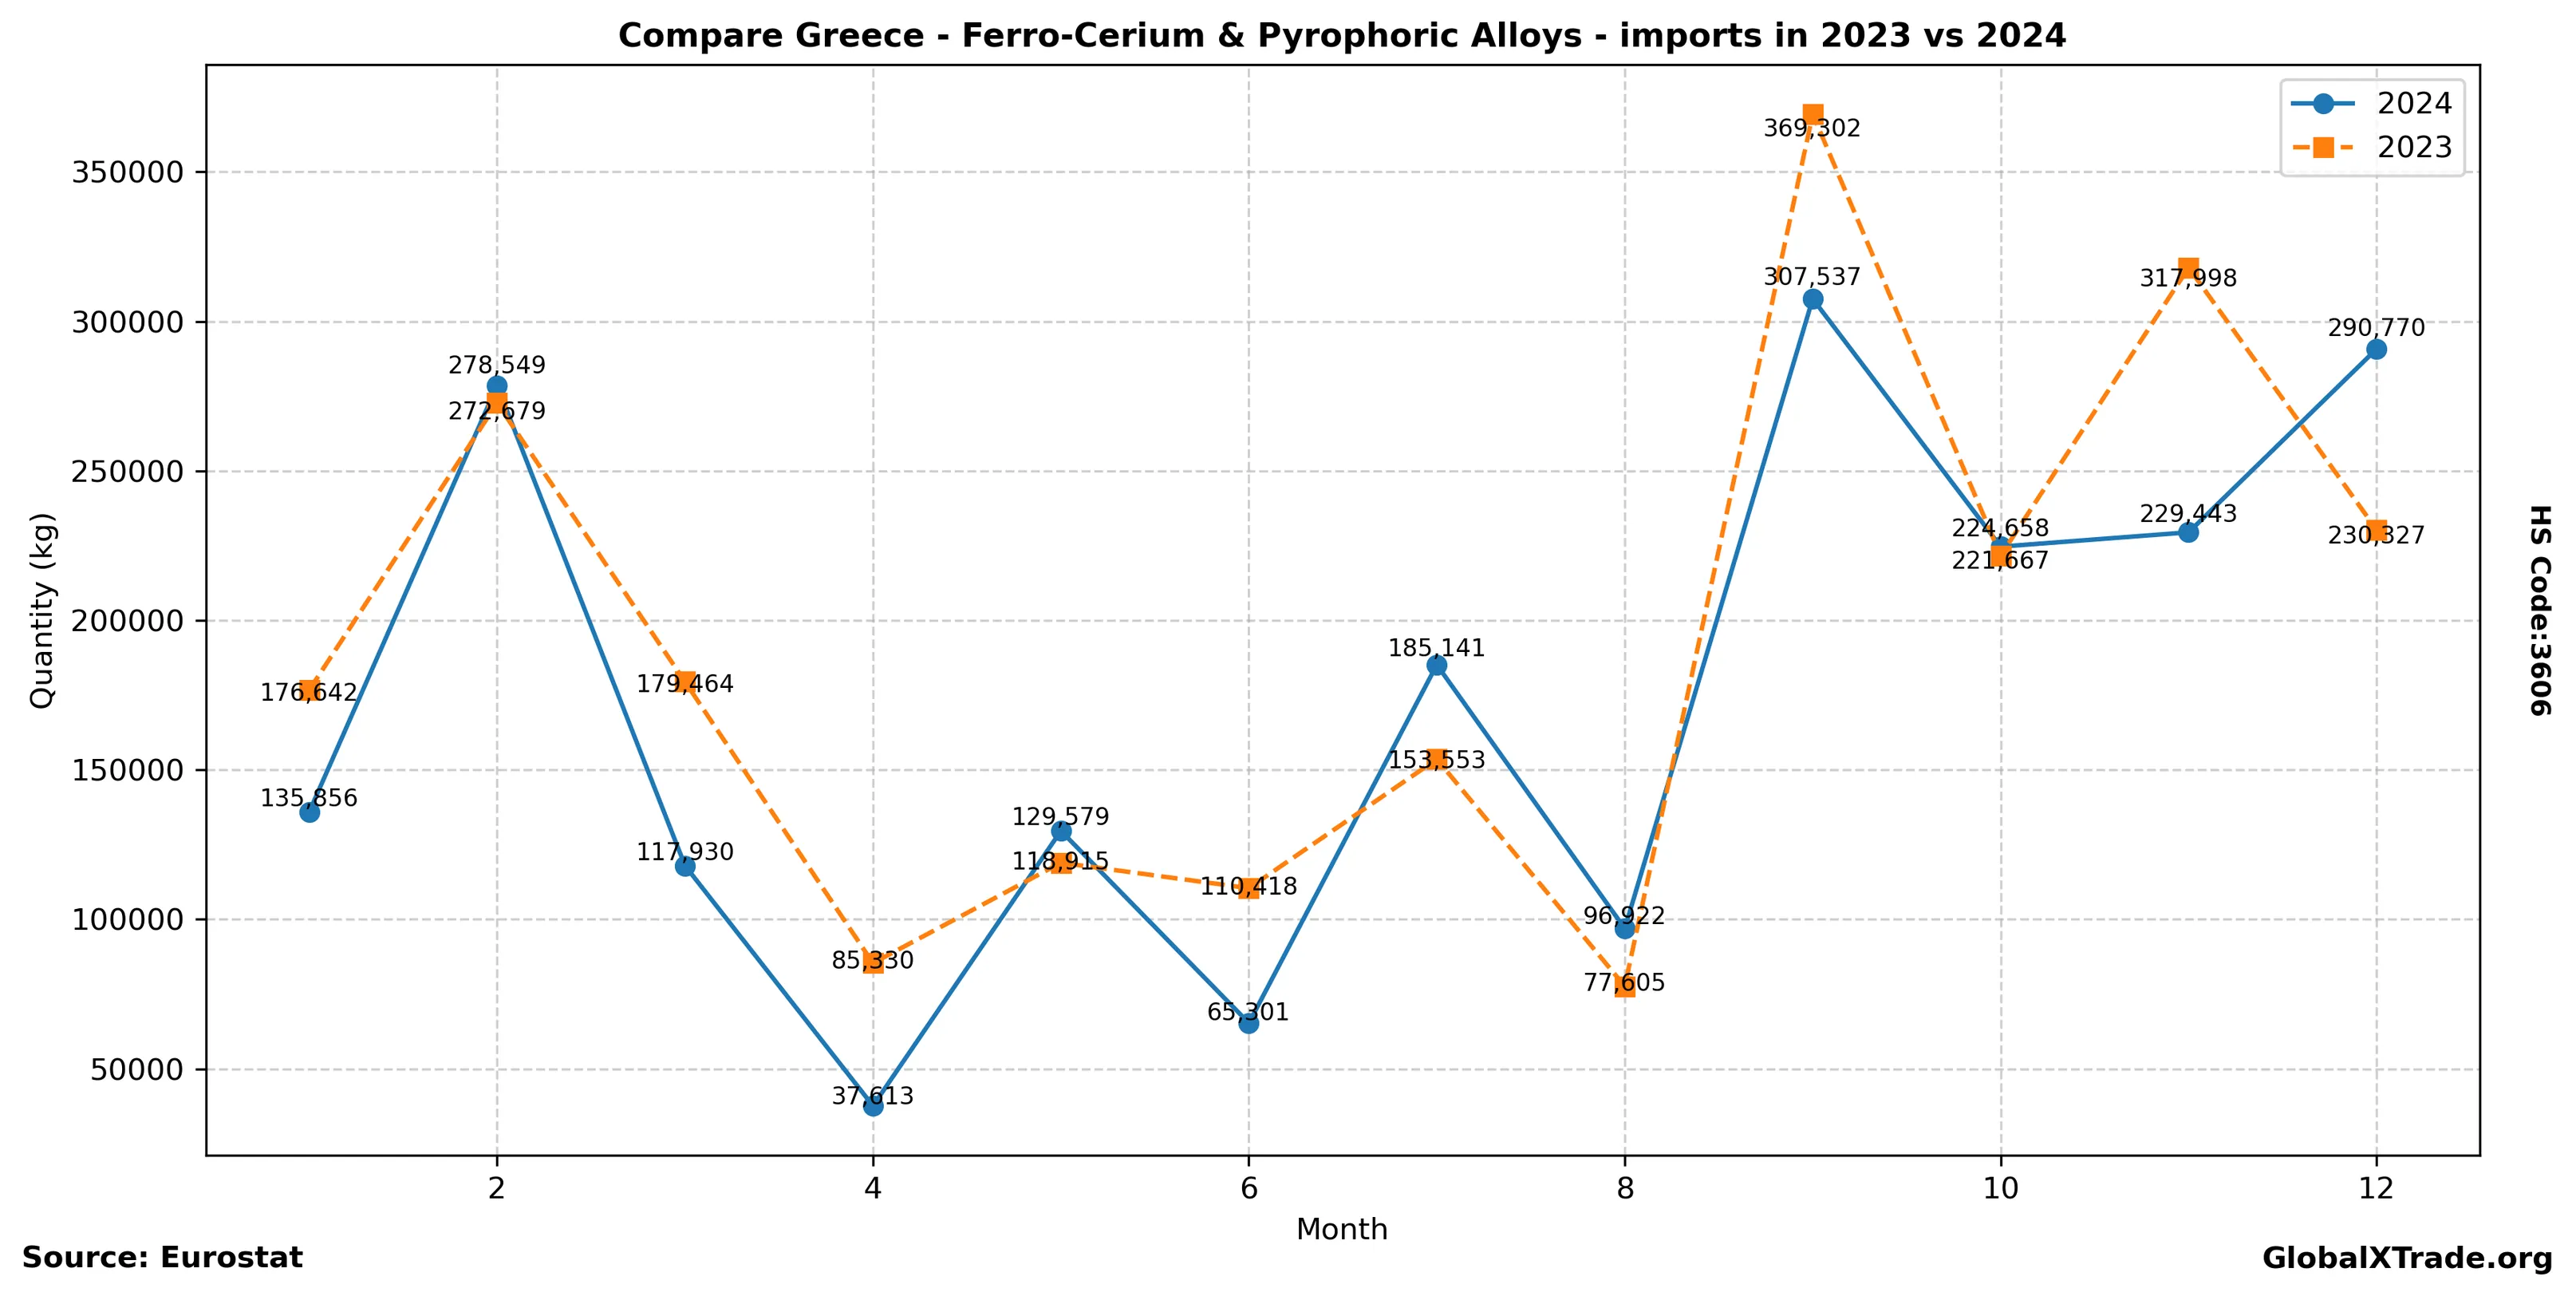
• Greek imports of ferro-cerium and pyrophoric alloys rose 2.3% year-over-year in June to 4,200 tons.
• This increase can be attributed to the country’s growing manufacturing sector, driven by investment in the automotive and aerospace industries.
• Global prices for these specialty metals have remained stable in recent months, averaging around $45 per kilogram.
Greek imports of ferro-cerium and pyrophoric alloys continued their modest upward trend in June, with a 2.3% year-over-year increase to 4,200 tons. Industry analysts attribute this growth to the expanding European steel sector, which is driving demand for these specialized metals. The steady global prices have also contributed to the country’s rising imports.
Yearly Import Summary
| year | total_quantity_kg | total_value_eur |
|---|---|---|
| 2020 | 2,287,089 | 3,061,200 |
| 2021 | 2,965,243 | 3,819,008 |
| 2022 | 2,911,434 | 5,603,254 |
| 2023 | 2,313,900 | 4,368,545 |
| 2024 | 2,099,299 | 3,803,273 |
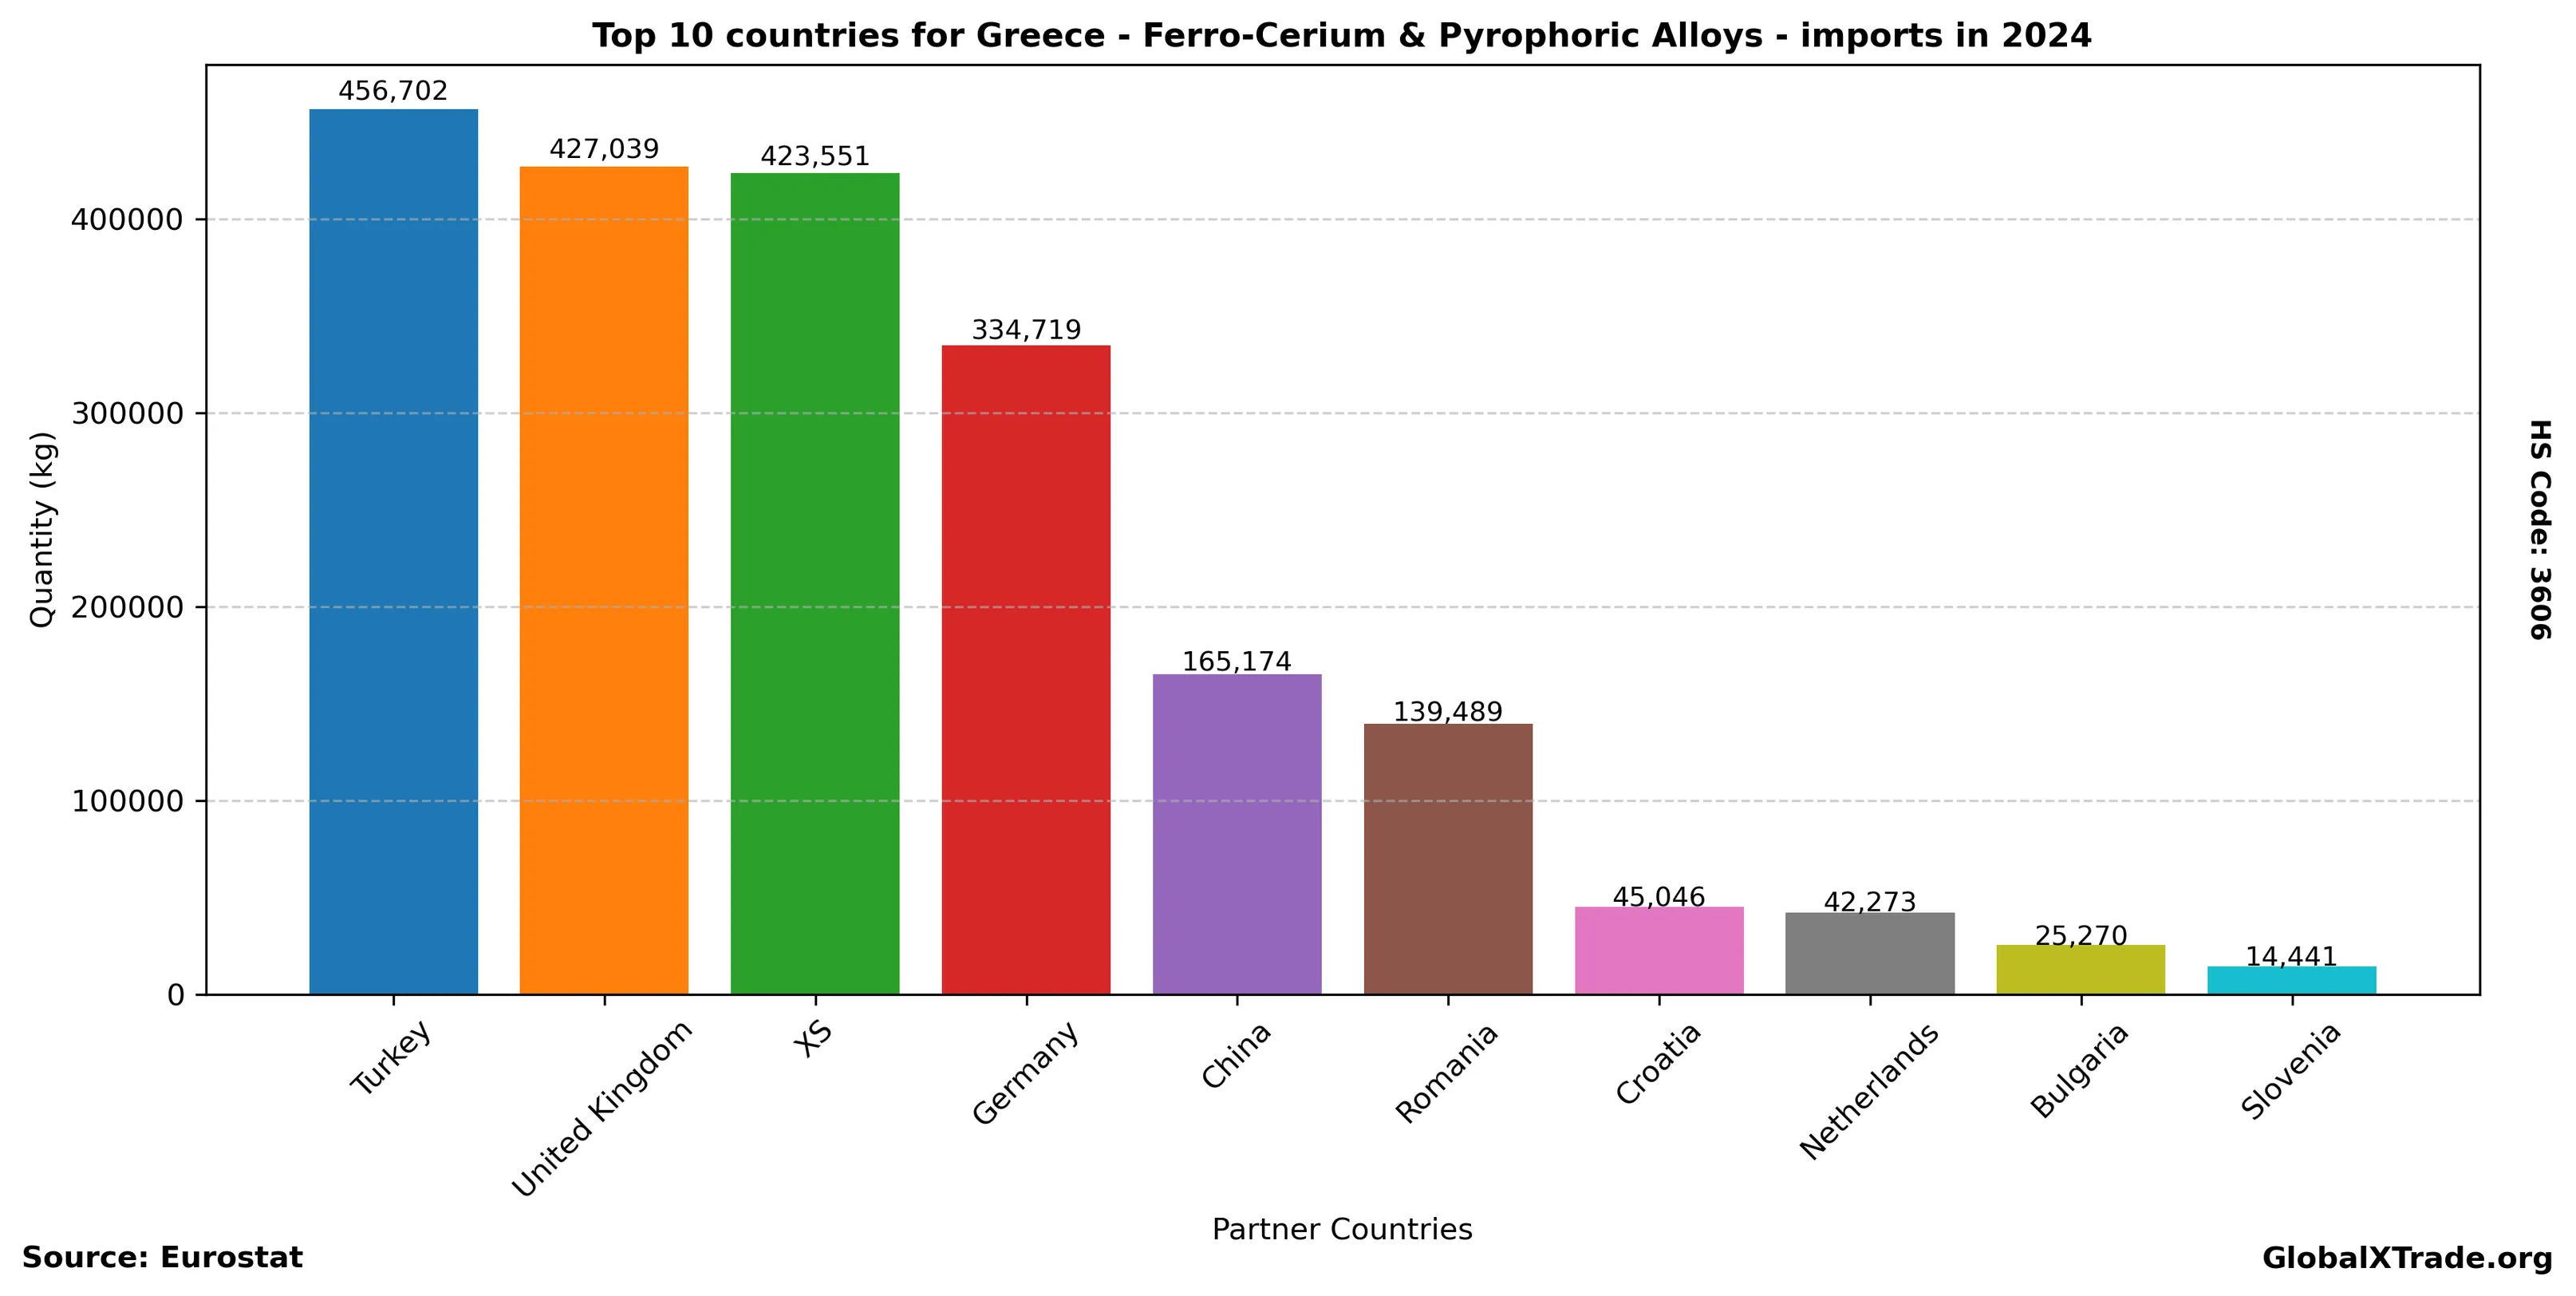
Top Partner Countries 2024
| partner | total_quantity_kg | total_value_eur |
|---|---|---|
| Turkey | 456,702 | 685,280 |
| United Kingdom | 427,039 | 773,786 |
| XS | 423,551 | 870,420 |
| Germany | 334,719 | 562,271 |
| China | 165,174 | 325,272 |
| Romania | 139,489 | 170,754 |
| Croatia | 45,046 | 64,217 |
| Netherlands | 42,273 | 106,588 |
| Bulgaria | 25,270 | 83,686 |
| Slovenia | 14,441 | 32,340 |
Top Partner Countries 2023
| partner | total_quantity_kg | total_value_eur |
|---|---|---|
| XS | 633,528 | 1,301,761 |
| Turkey | 531,672 | 909,511 |
| United Kingdom | 446,624 | 845,831 |
| Germany | 231,155 | 446,599 |
| China | 135,419 | 256,313 |
| Bulgaria | 78,073 | 143,352 |
| Romania | 77,964 | 97,574 |
| Ireland | 77,552 | 112,783 |
| India | 40,584 | 43,482 |
| Netherlands | 23,102 | 45,932 |