**Greek Imports of Frozen Desserts Rise in Q2**
**Greece’s frozen dessert imports surge as summer demand picks up**
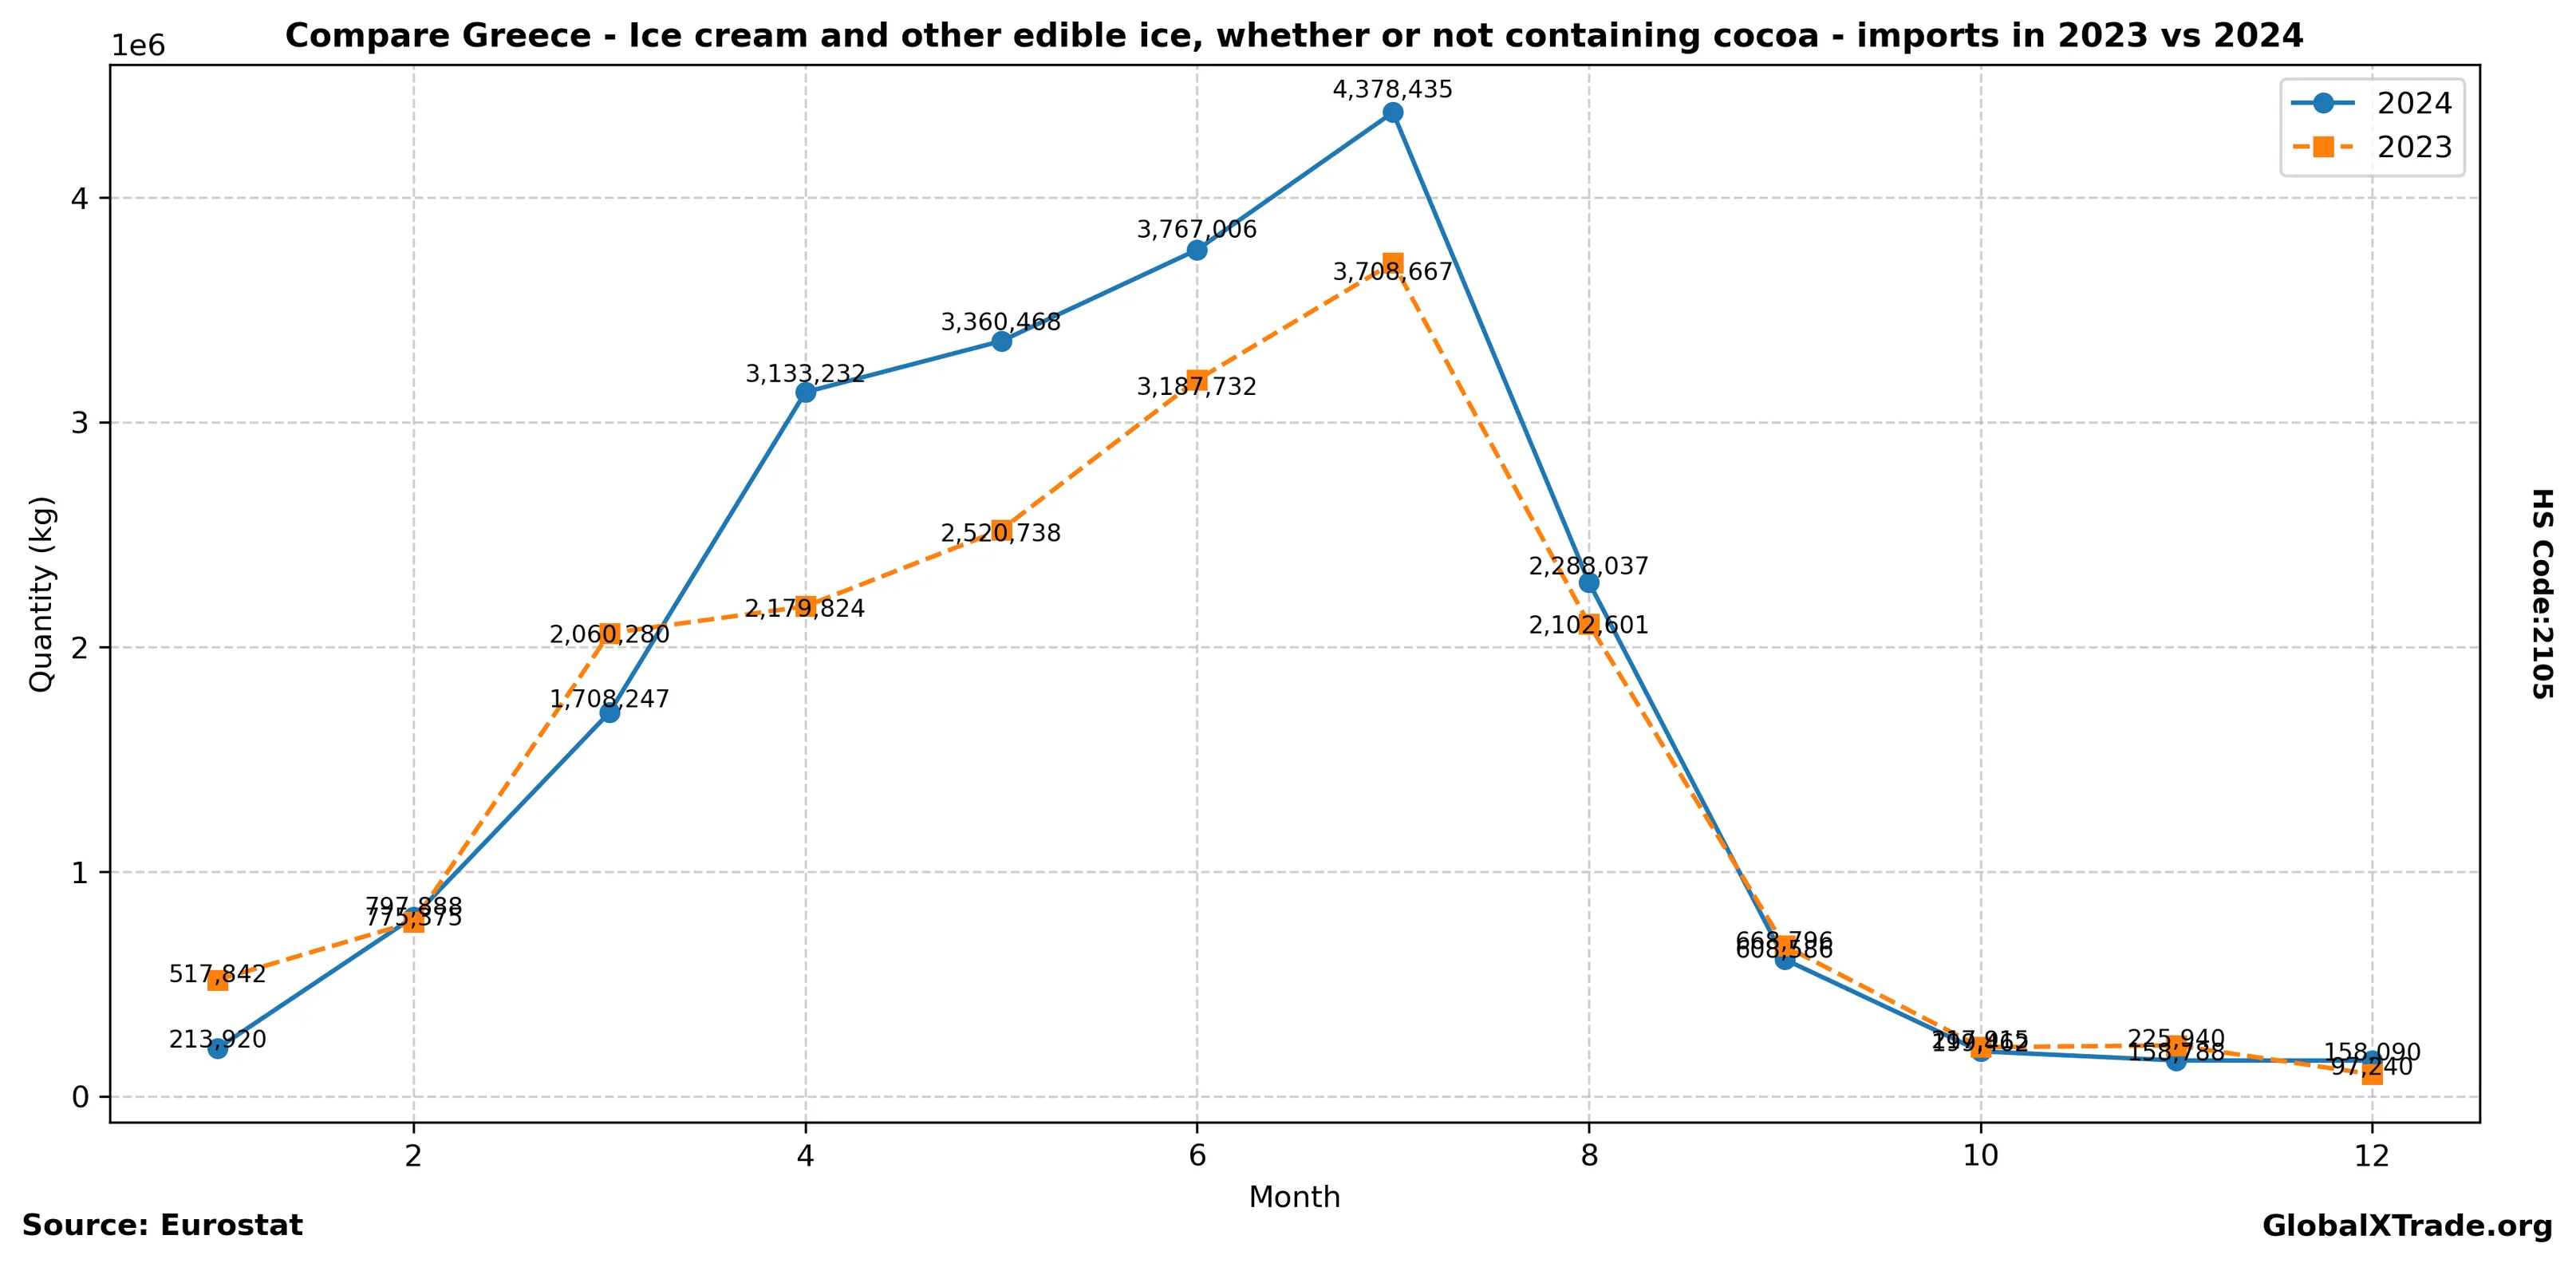
• Greek importers brought in 12.5% more frozen desserts from EU countries in the second quarter compared to the same period last year.
• The majority of these imports came from Italy, accounting for approximately 60% of total EU shipments.
• Frozen dessert prices remained relatively stable due to steady milk and sugar supplies, despite a moderate increase in demand ahead of the summer season.
Greek importers have been increasing their frozen dessert purchases as warmer weather boosts demand for ice cream and other edible ice products. The country’s imports from EU countries rose in Q2, driven primarily by Italy, which supplied around 60% of total shipments. Prices remained stable due to steady milk and sugar supplies.
Yearly Import Summary
| year | total_quantity_kg | total_value_eur |
|---|---|---|
| 2020 | 17,529,304 | 54,042,698 |
| 2021 | 18,987,675 | 47,520,085 |
| 2022 | 19,400,263 | 52,897,369 |
| 2023 | 18,262,950 | 62,778,582 |
| 2024 | 20,772,159 | 70,649,241 |
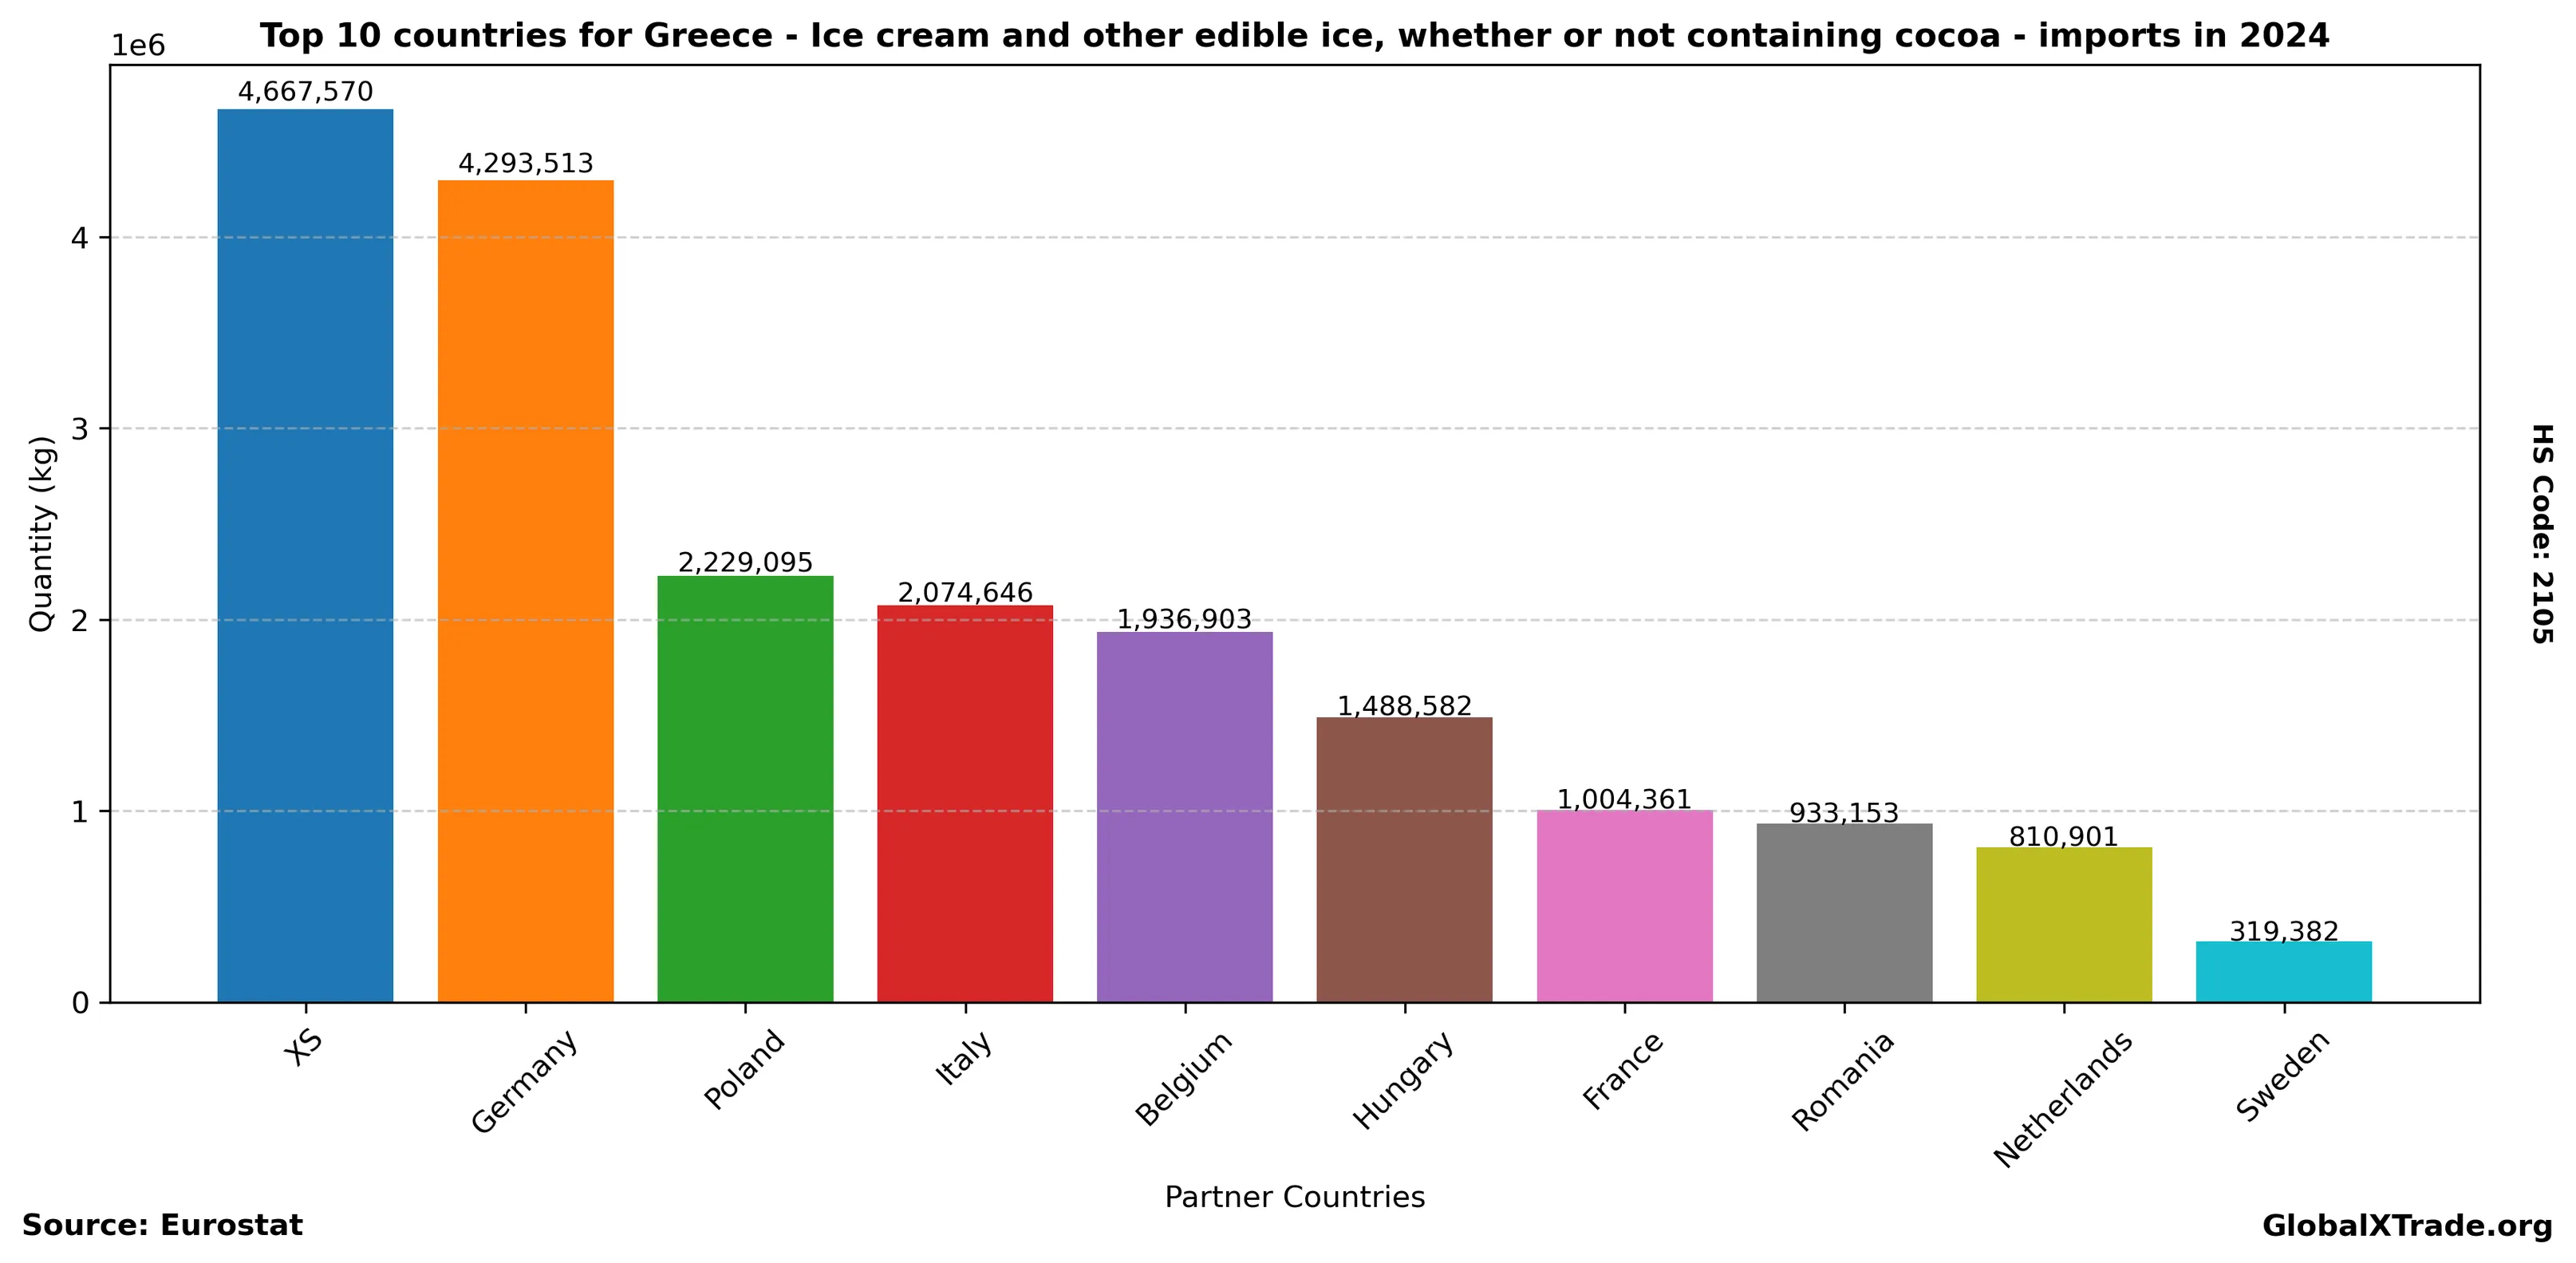
Top Partner Countries 2024
| partner | total_quantity_kg | total_value_eur |
|---|---|---|
| XS | 4,667,570 | 14,222,675 |
| Germany | 4,293,513 | 14,342,265 |
| Poland | 2,229,095 | 7,982,067 |
| Italy | 2,074,646 | 6,942,709 |
| Belgium | 1,936,903 | 6,841,503 |
| Hungary | 1,488,582 | 5,008,766 |
| France | 1,004,361 | 4,777,889 |
| Romania | 933,153 | 2,450,198 |
| Netherlands | 810,901 | 3,029,665 |
| Sweden | 319,382 | 1,094,827 |
Top Partner Countries 2023
| partner | total_quantity_kg | total_value_eur |
|---|---|---|
| XS | 4,434,061 | 13,964,237 |
| Germany | 3,977,128 | 14,009,747 |
| Poland | 1,915,671 | 6,421,861 |
| Hungary | 1,663,972 | 5,546,704 |
| Belgium | 1,622,007 | 5,654,577 |
| Italy | 1,605,379 | 5,401,209 |
| France | 888,456 | 3,784,532 |
| Netherlands | 696,165 | 2,853,852 |
| Sweden | 291,610 | 1,052,346 |
| Portugal | 245,401 | 621,818 |