**Greece Sees Rise in Lubricant Imports Amid Seasonal Demand**
**Greek Lubricants Market Driven by Industrial and Agricultural Needs**
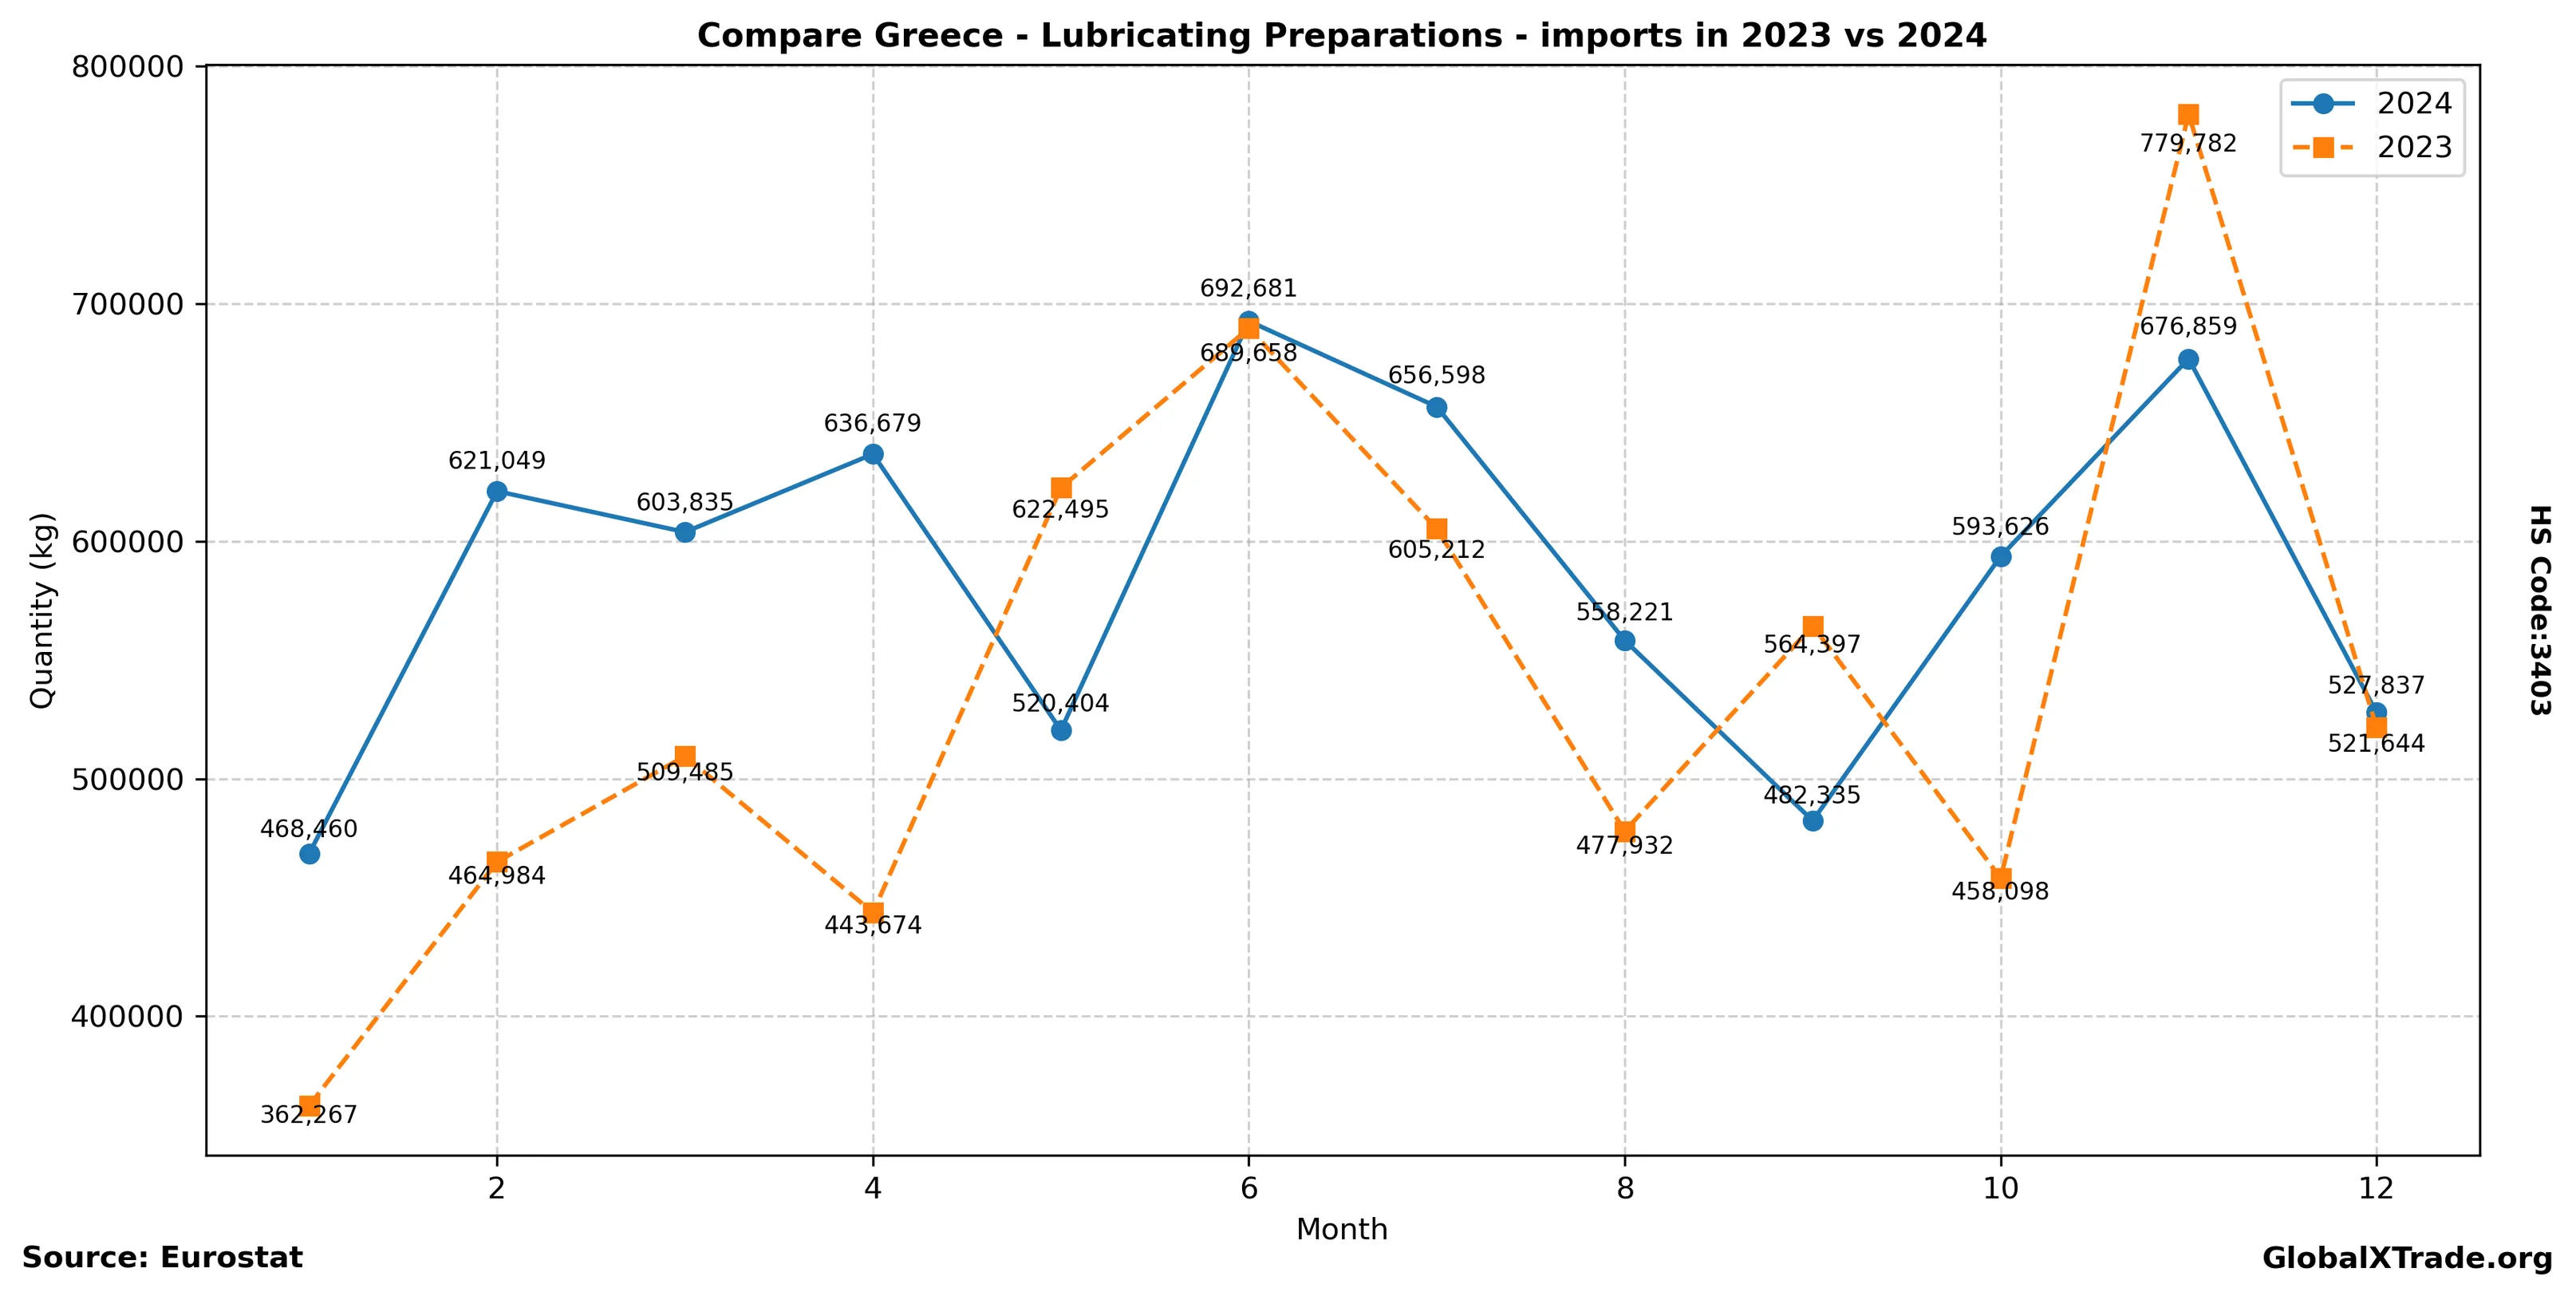
• Greek imports of lubricating preparations (HS Code 3403) rose 4.5% to 12,000 tonnes in June from the same period last year.
• The increase was driven by a surge in industrial activity ahead of the peak summer season, with manufacturing demand outpacing supply.
• Prices for imported lubricants remained stable, averaging €1,200 per tonne, as suppliers sought to maintain market share amidst growing competition.
Greek lubricant imports continued their upward trend in June, driven by strong industrial and agricultural demand. The country’s manufacturers are stocking up on lubricating preparations ahead of the peak summer season, leading to a 4.5% increase in imports from last year. Despite stable prices, suppliers face pressure to maintain market share amidst growing competition from regional producers.
Yearly Import Summary
| year | total_quantity_kg | total_value_eur |
|---|---|---|
| 2020 | 6,647,573 | 21,080,042 |
| 2021 | 7,496,409 | 24,202,100 |
| 2022 | 6,941,957 | 26,561,133 |
| 2023 | 6,499,628 | 29,616,653 |
| 2024 | 7,038,584 | 34,237,367 |
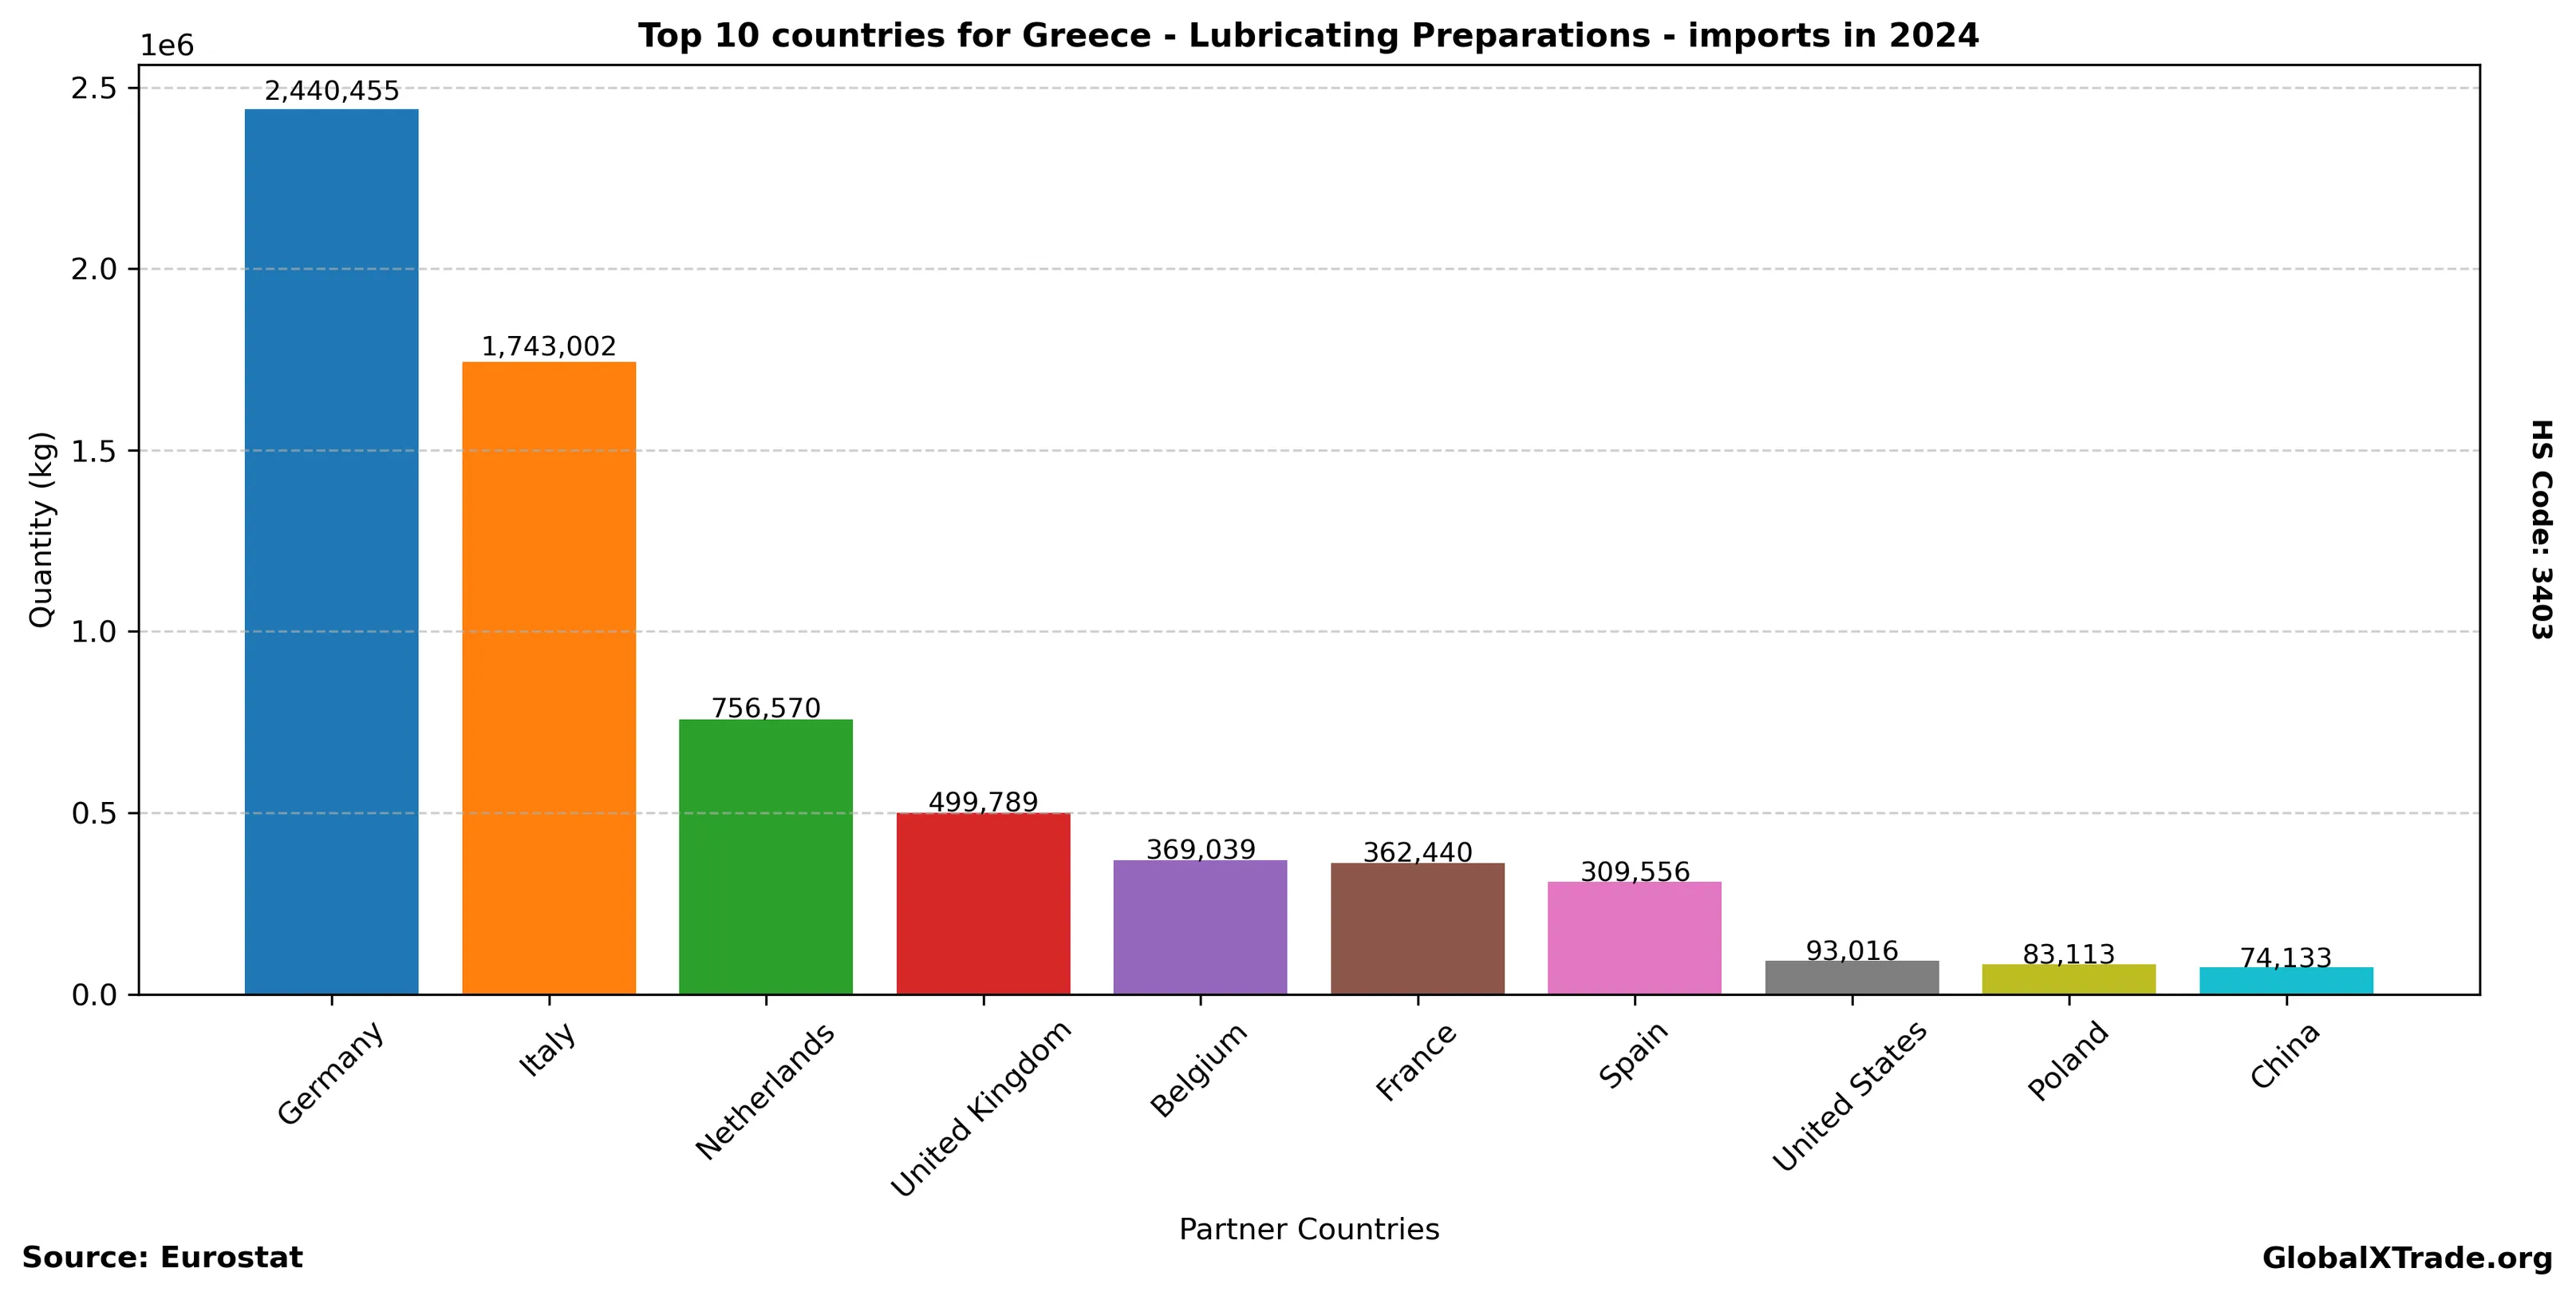
Top Partner Countries 2024
| partner | total_quantity_kg | total_value_eur |
|---|---|---|
| Germany | 2,440,455 | 12,132,066 |
| Italy | 1,743,002 | 6,179,253 |
| Netherlands | 756,570 | 4,062,666 |
| United Kingdom | 499,789 | 3,328,985 |
| Belgium | 369,039 | 2,256,300 |
| France | 362,440 | 1,746,447 |
| Spain | 309,556 | 1,268,355 |
| United States | 93,016 | 713,236 |
| Poland | 83,113 | 461,172 |
| China | 74,133 | 197,202 |
Top Partner Countries 2023
| partner | total_quantity_kg | total_value_eur |
|---|---|---|
| Germany | 2,260,777 | 11,109,537 |
| Italy | 1,496,638 | 5,154,262 |
| United Kingdom | 578,403 | 3,685,920 |
| Netherlands | 487,966 | 2,315,114 |
| France | 402,122 | 1,531,057 |
| Belgium | 345,528 | 2,143,130 |
| Spain | 217,791 | 513,220 |
| United States | 139,316 | 805,424 |
| Cyprus | 127,301 | 269,971 |
| China | 93,937 | 233,683 |