.webp)
**Greek Imports of Petroleum Resins Surge Amid Seasonal Demand**
**Greece’s Energy Sector Sees Boost in Imported Resin Supplies**
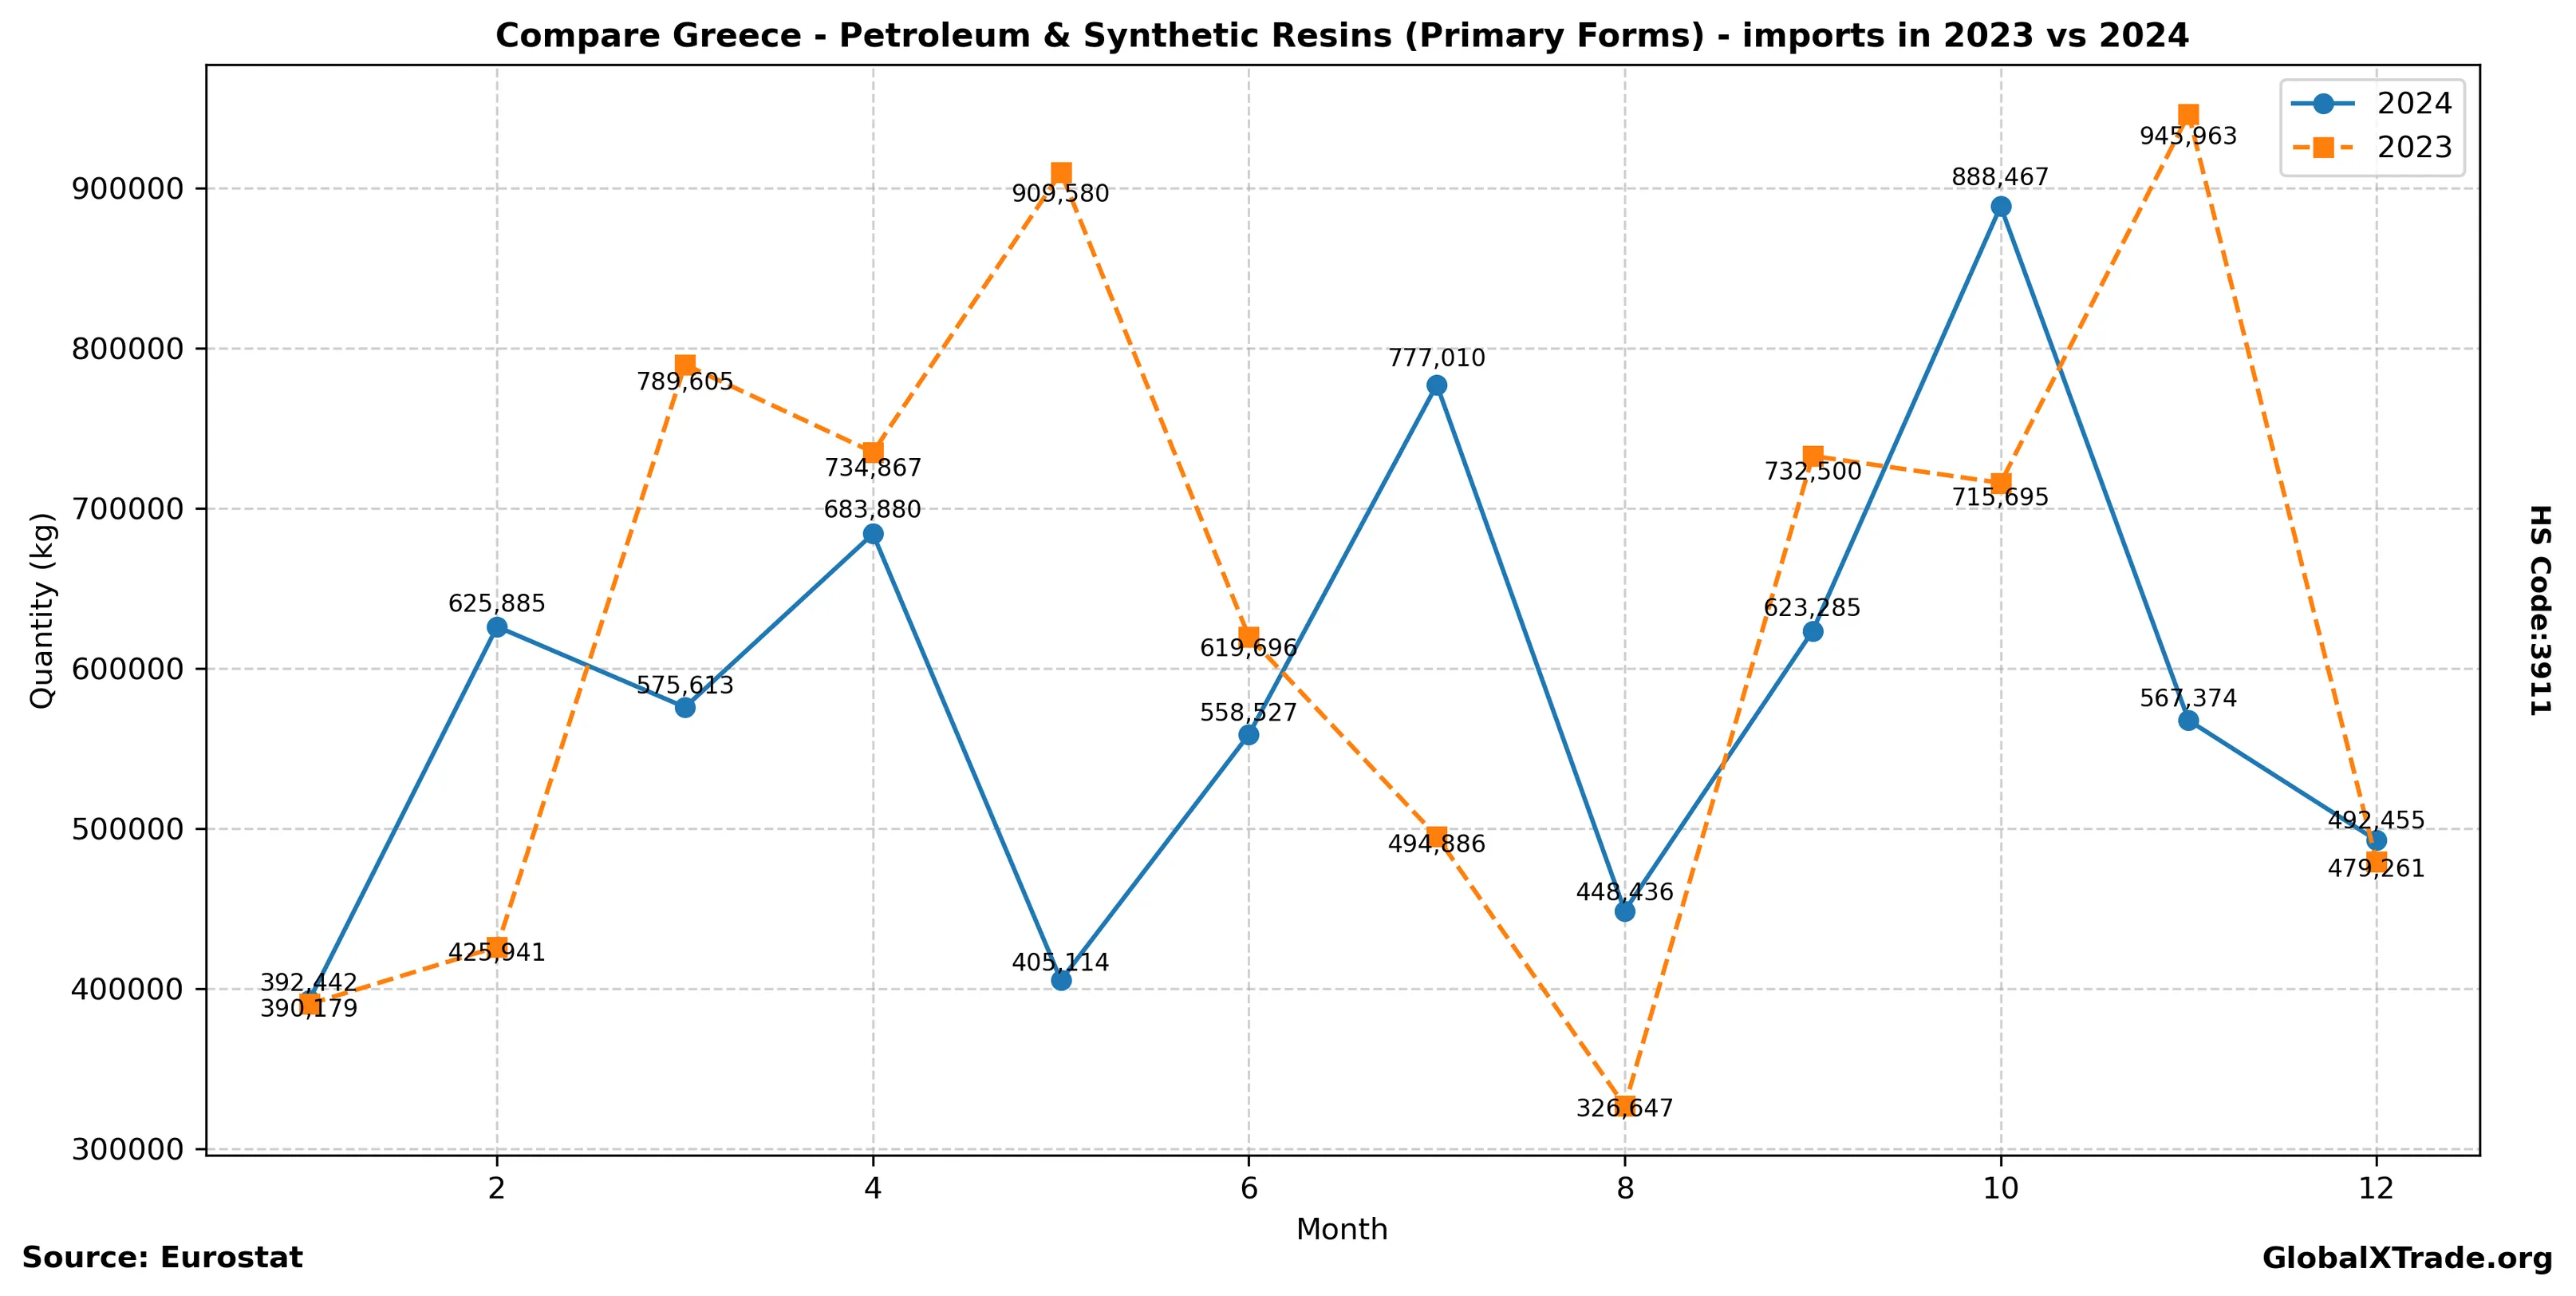
• Greek imports of petroleum resins rose 15% YoY in June, driven by increased demand for downstream products.
• The surge is attributed to seasonal factors, as temperatures rise and energy consumption increases across the country.
• Global prices for petroleum resins have stabilized this quarter, contributing to Greece’s lower import costs.
Greece’s imports of petroleum resins, a key component in various industrial applications, experienced a notable uptick in June. This increase coincides with the start of peak summer demand, as households and industries rely more heavily on energy-intensive products. The stabilization of global prices has also helped reduce Greece’s import costs, making its energy sector slightly more competitive.
Yearly Import Summary
| year | total_quantity_kg | total_value_eur |
|---|---|---|
| 2020 | 6,335,256 | 15,883,485 |
| 2021 | 6,851,531 | 16,745,294 |
| 2022 | 7,715,159 | 23,390,599 |
| 2023 | 7,564,820 | 22,135,612 |
| 2024 | 7,038,488 | 19,879,929 |
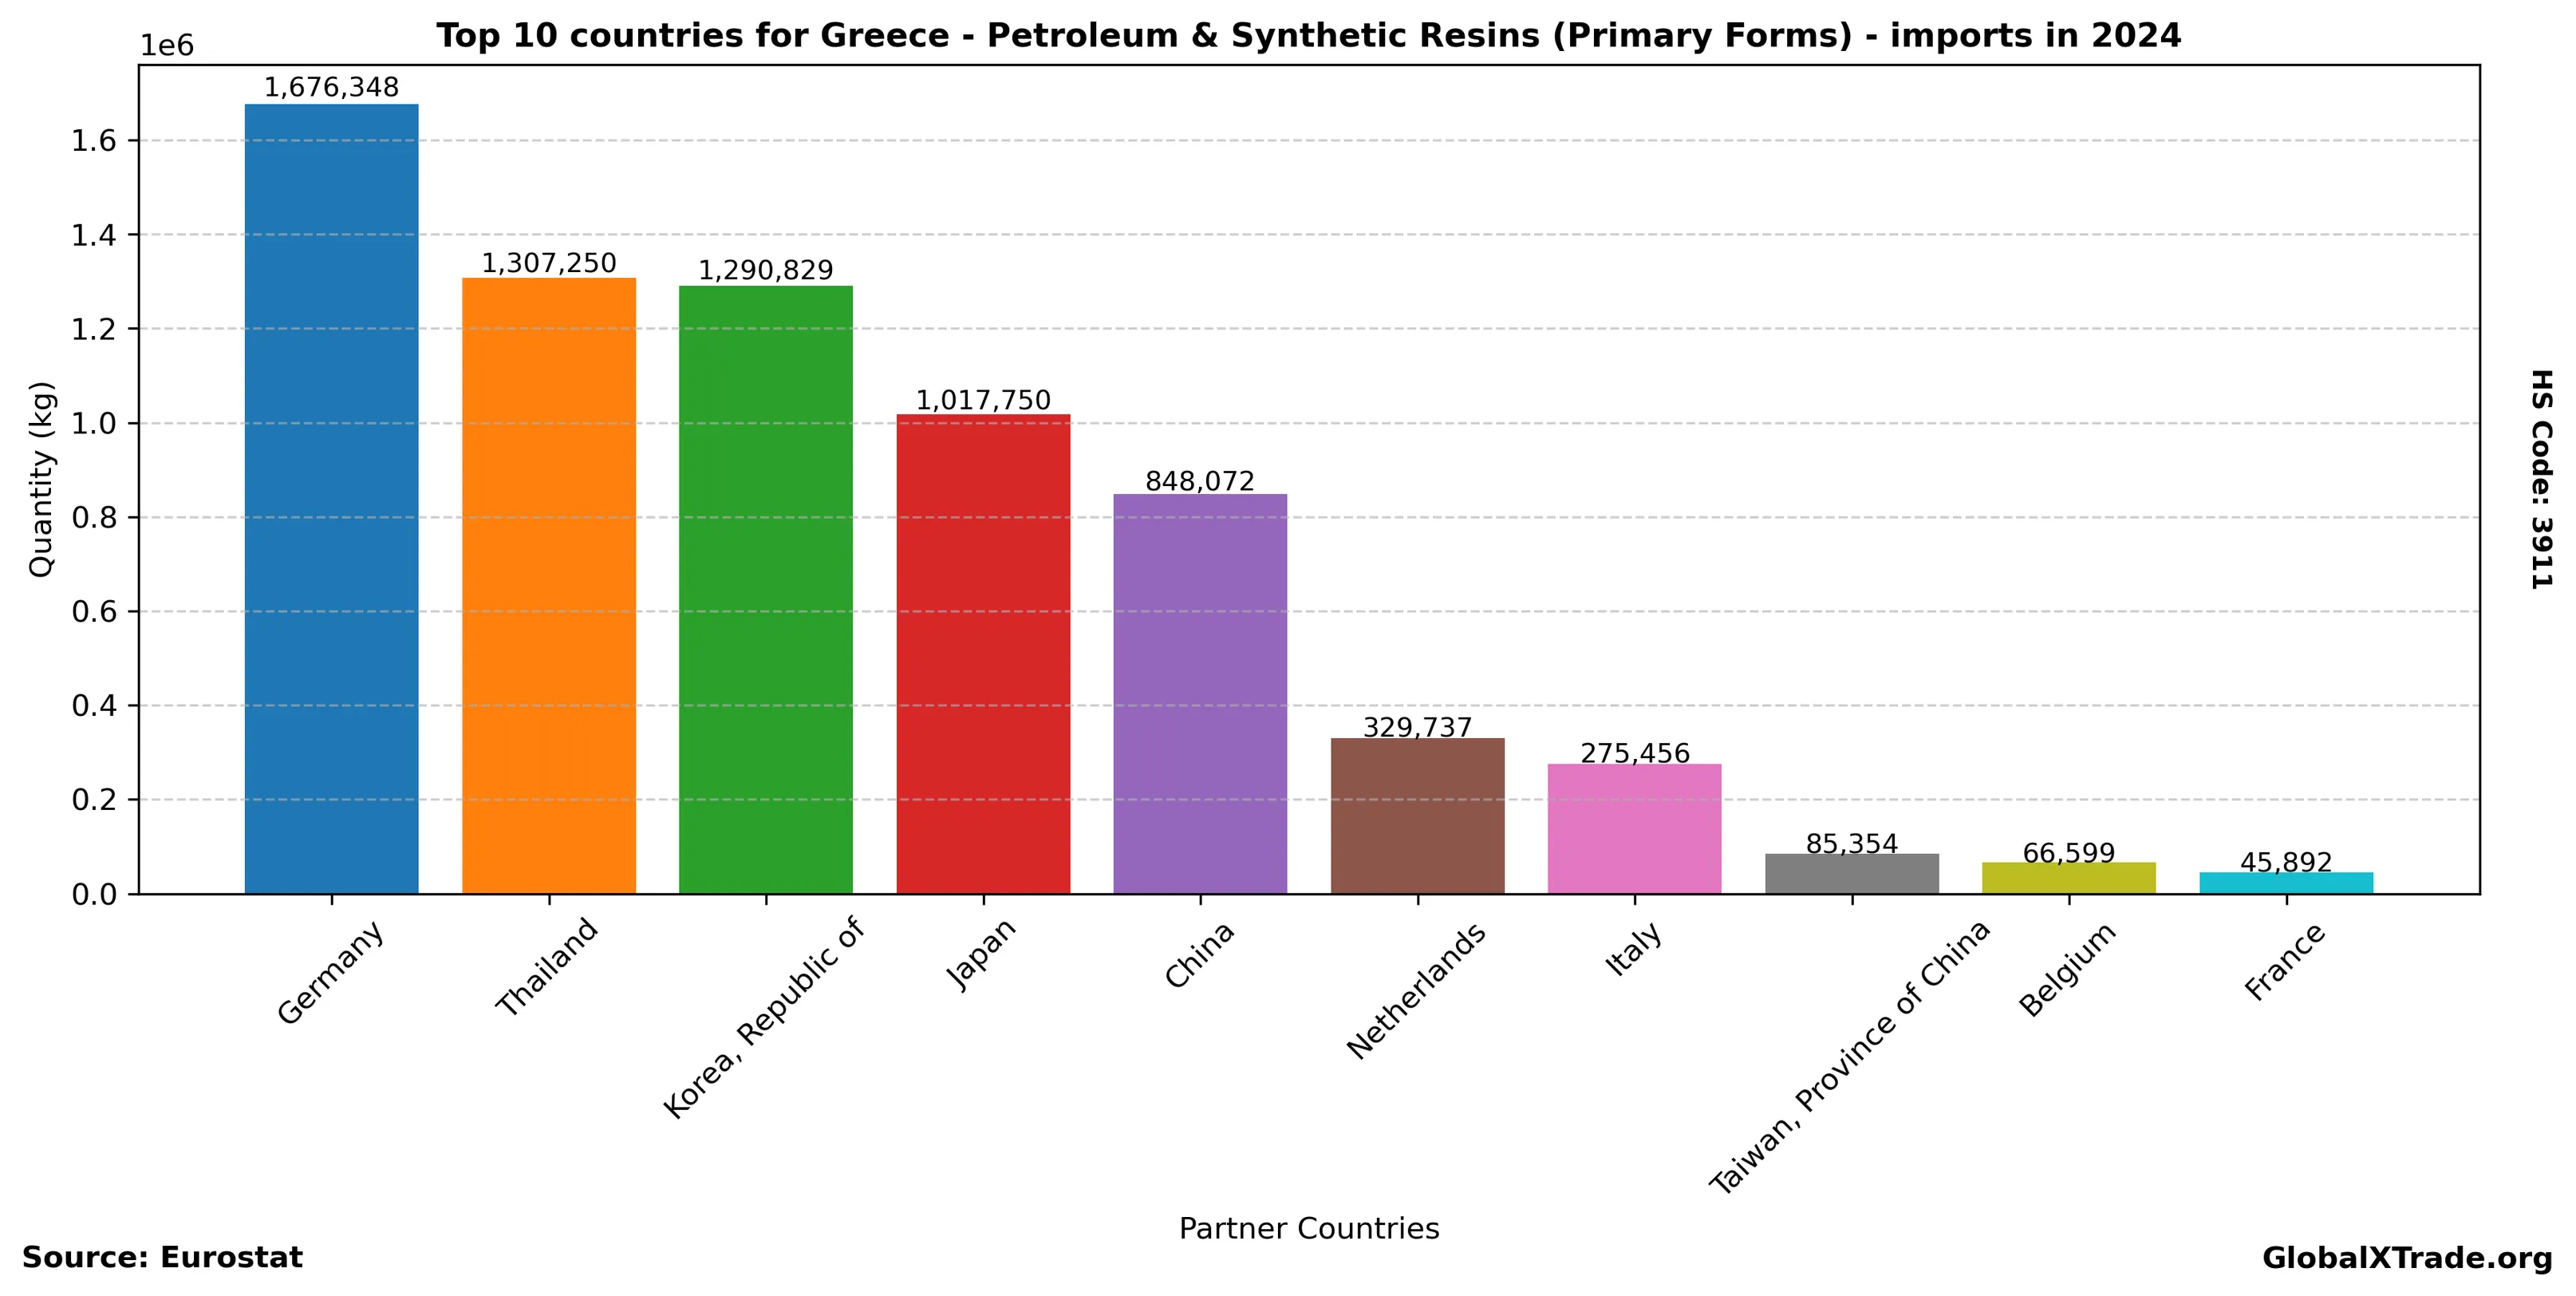
Top Partner Countries 2024
| partner | total_quantity_kg | total_value_eur |
|---|---|---|
| Germany | 1,676,348 | 6,550,429 |
| Thailand | 1,307,250 | 2,255,408 |
| Korea, Republic of | 1,290,829 | 2,301,345 |
| Japan | 1,017,750 | 1,776,051 |
| China | 848,072 | 1,453,681 |
| Netherlands | 329,737 | 624,160 |
| Italy | 275,456 | 1,654,371 |
| Taiwan, Province of China | 85,354 | 1,975,756 |
| Belgium | 66,599 | 400,351 |
| France | 45,892 | 304,980 |
Top Partner Countries 2023
| partner | total_quantity_kg | total_value_eur |
|---|---|---|
| Germany | 2,115,126 | 6,579,998 |
| Thailand | 1,370,250 | 2,713,410 |
| Korea, Republic of | 1,140,271 | 2,217,827 |
| China | 1,004,361 | 1,431,175 |
| Japan | 436,628 | 781,189 |
| Italy | 407,750 | 1,937,854 |
| Belgium | 387,354 | 2,326,689 |
| France | 362,718 | 874,242 |
| Netherlands | 163,315 | 1,748,159 |
| Taiwan, Province of China | 107,151 | 1,227,408 |