**Greek Imports of Rubber and Plastic Additives Rise Amid Seasonal Demand**
**Market Trends Support Increased Activity in the Chemical Sector**
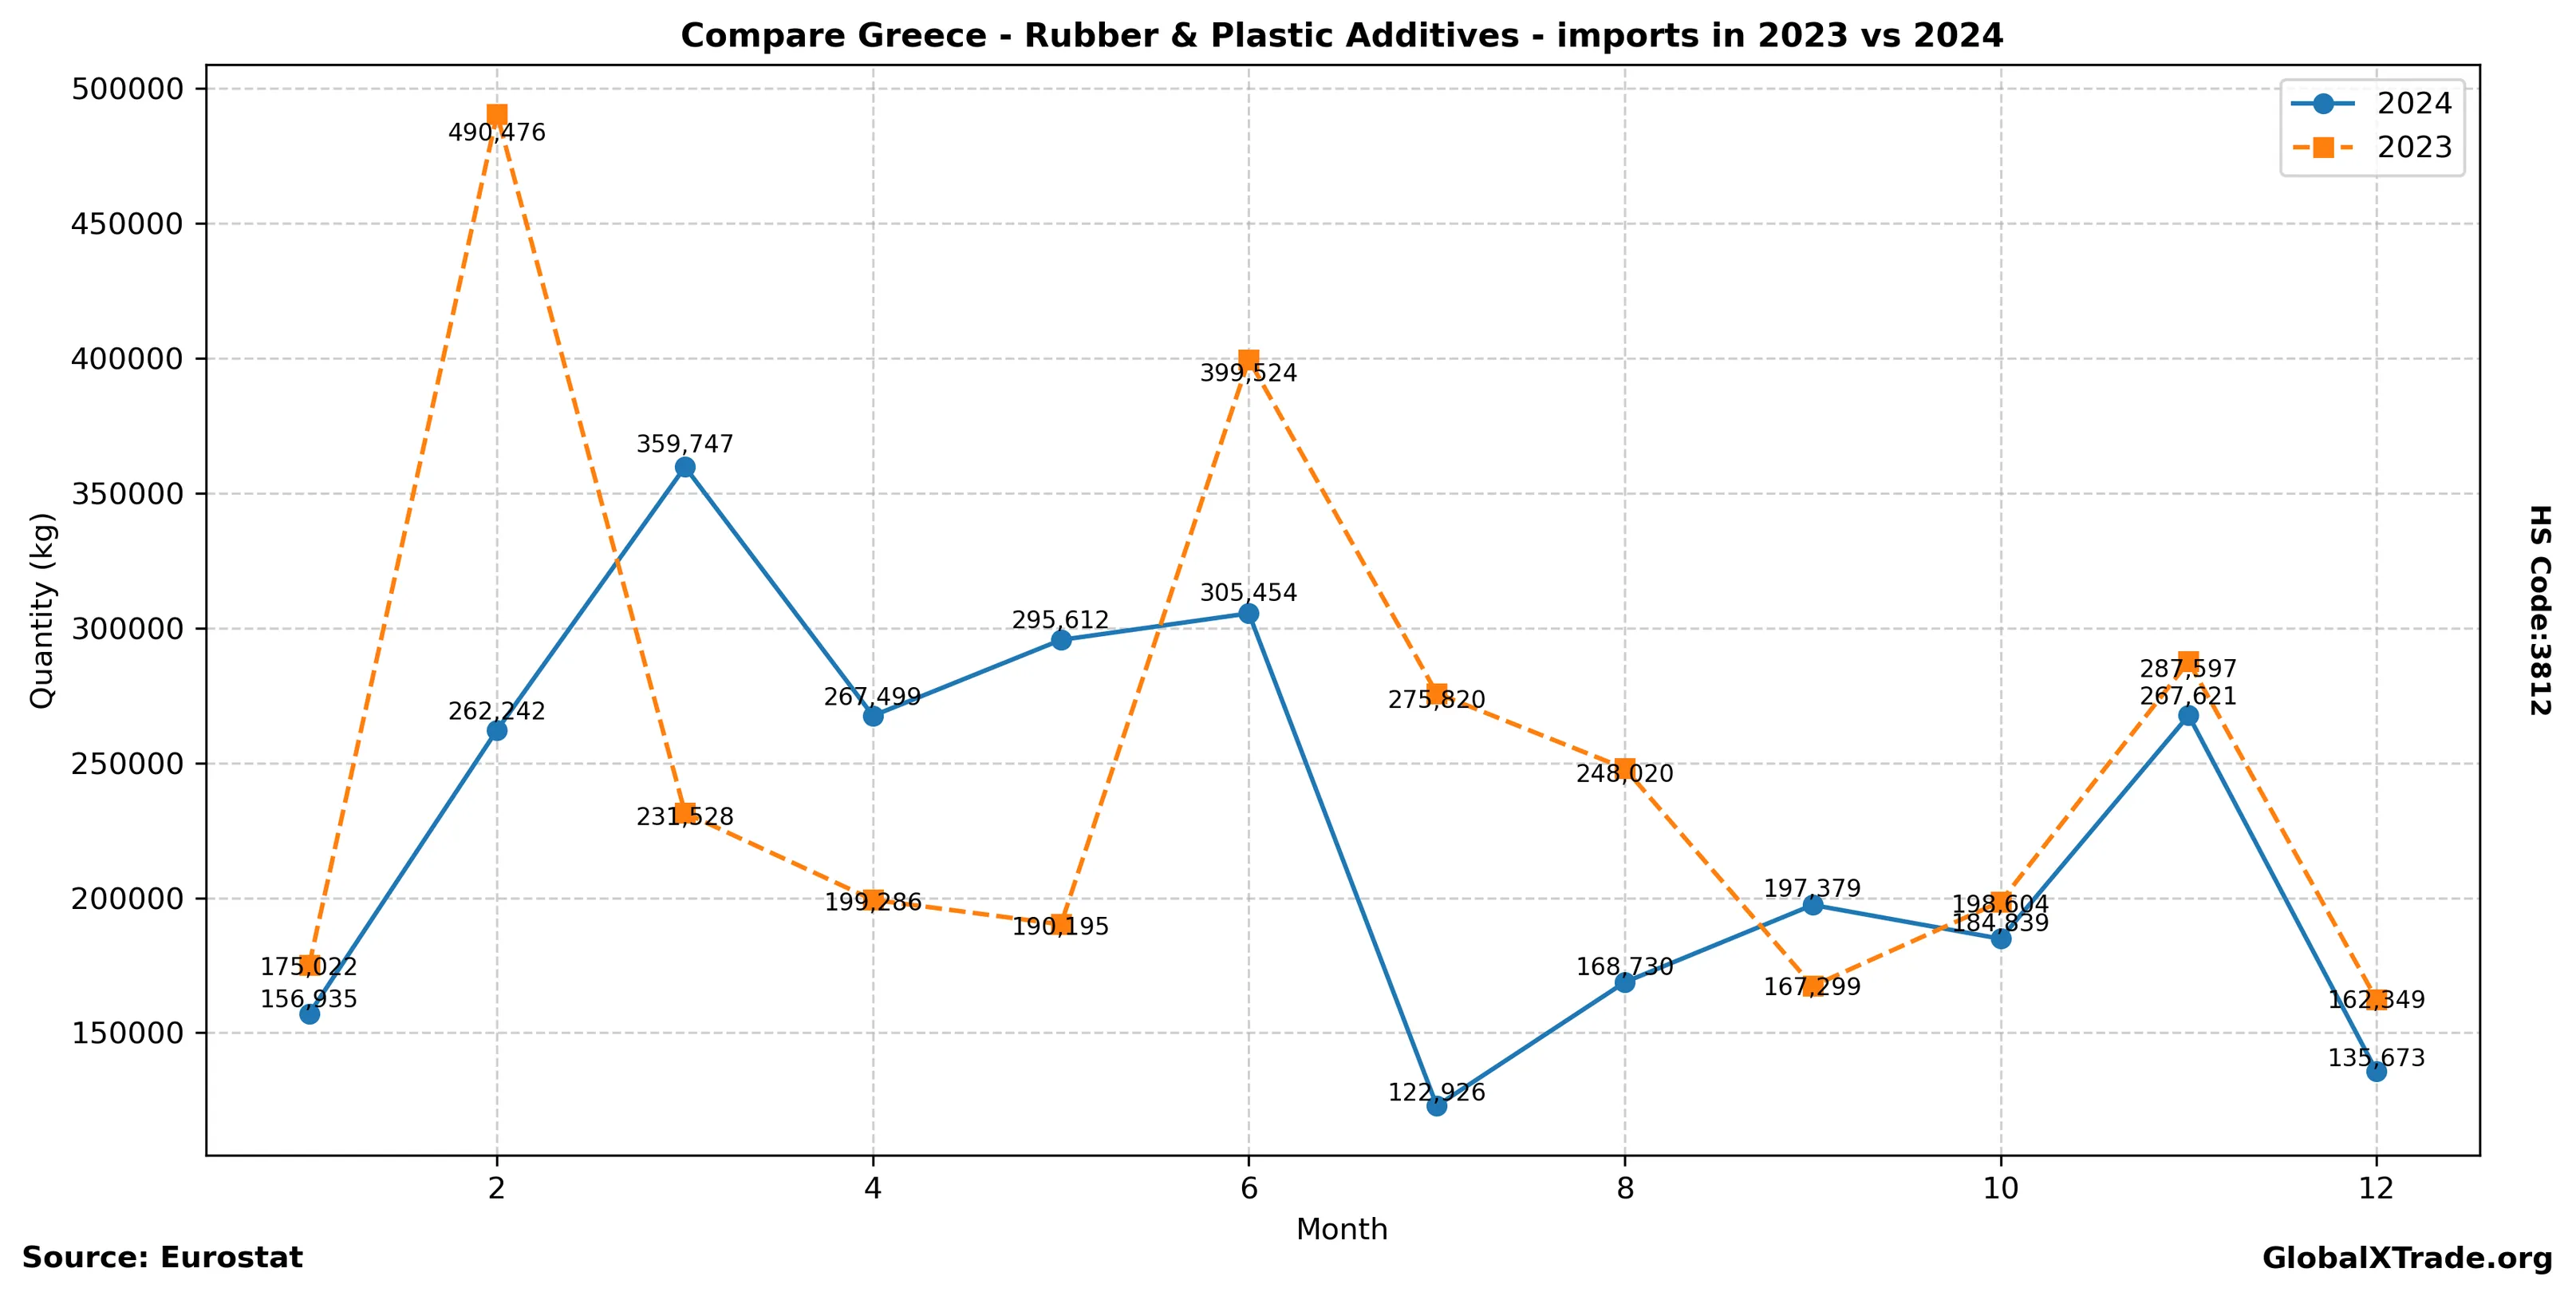
• Greek imports of rubber and plastic additives grew by 4.5% year-over-year to 12,500 metric tons in June.
• The increase is attributed to rising demand from the country’s automotive and manufacturing sectors ahead of summer production schedules.
• Prices for key additives such as phthalates and stearates edged up 2.3% over the same period due to supply chain tightness.
Greece’s imports of rubber and plastic additives continued their upward trajectory in June, driven by seasonal demand from the country’s manufacturing sector. The growth is consistent with broader market trends, which suggest a strengthening chemical industry. However, prices for key additives remain volatile due to ongoing supply chain constraints.
Yearly Import Summary
| year | total_quantity_kg | total_value_eur |
|---|---|---|
| 2020 | 2,751,613 | 12,378,304 |
| 2021 | 2,818,838 | 13,038,448 |
| 2022 | 2,787,942 | 12,621,120 |
| 2023 | 3,025,720 | 12,929,535 |
| 2024 | 2,724,657 | 13,883,622 |
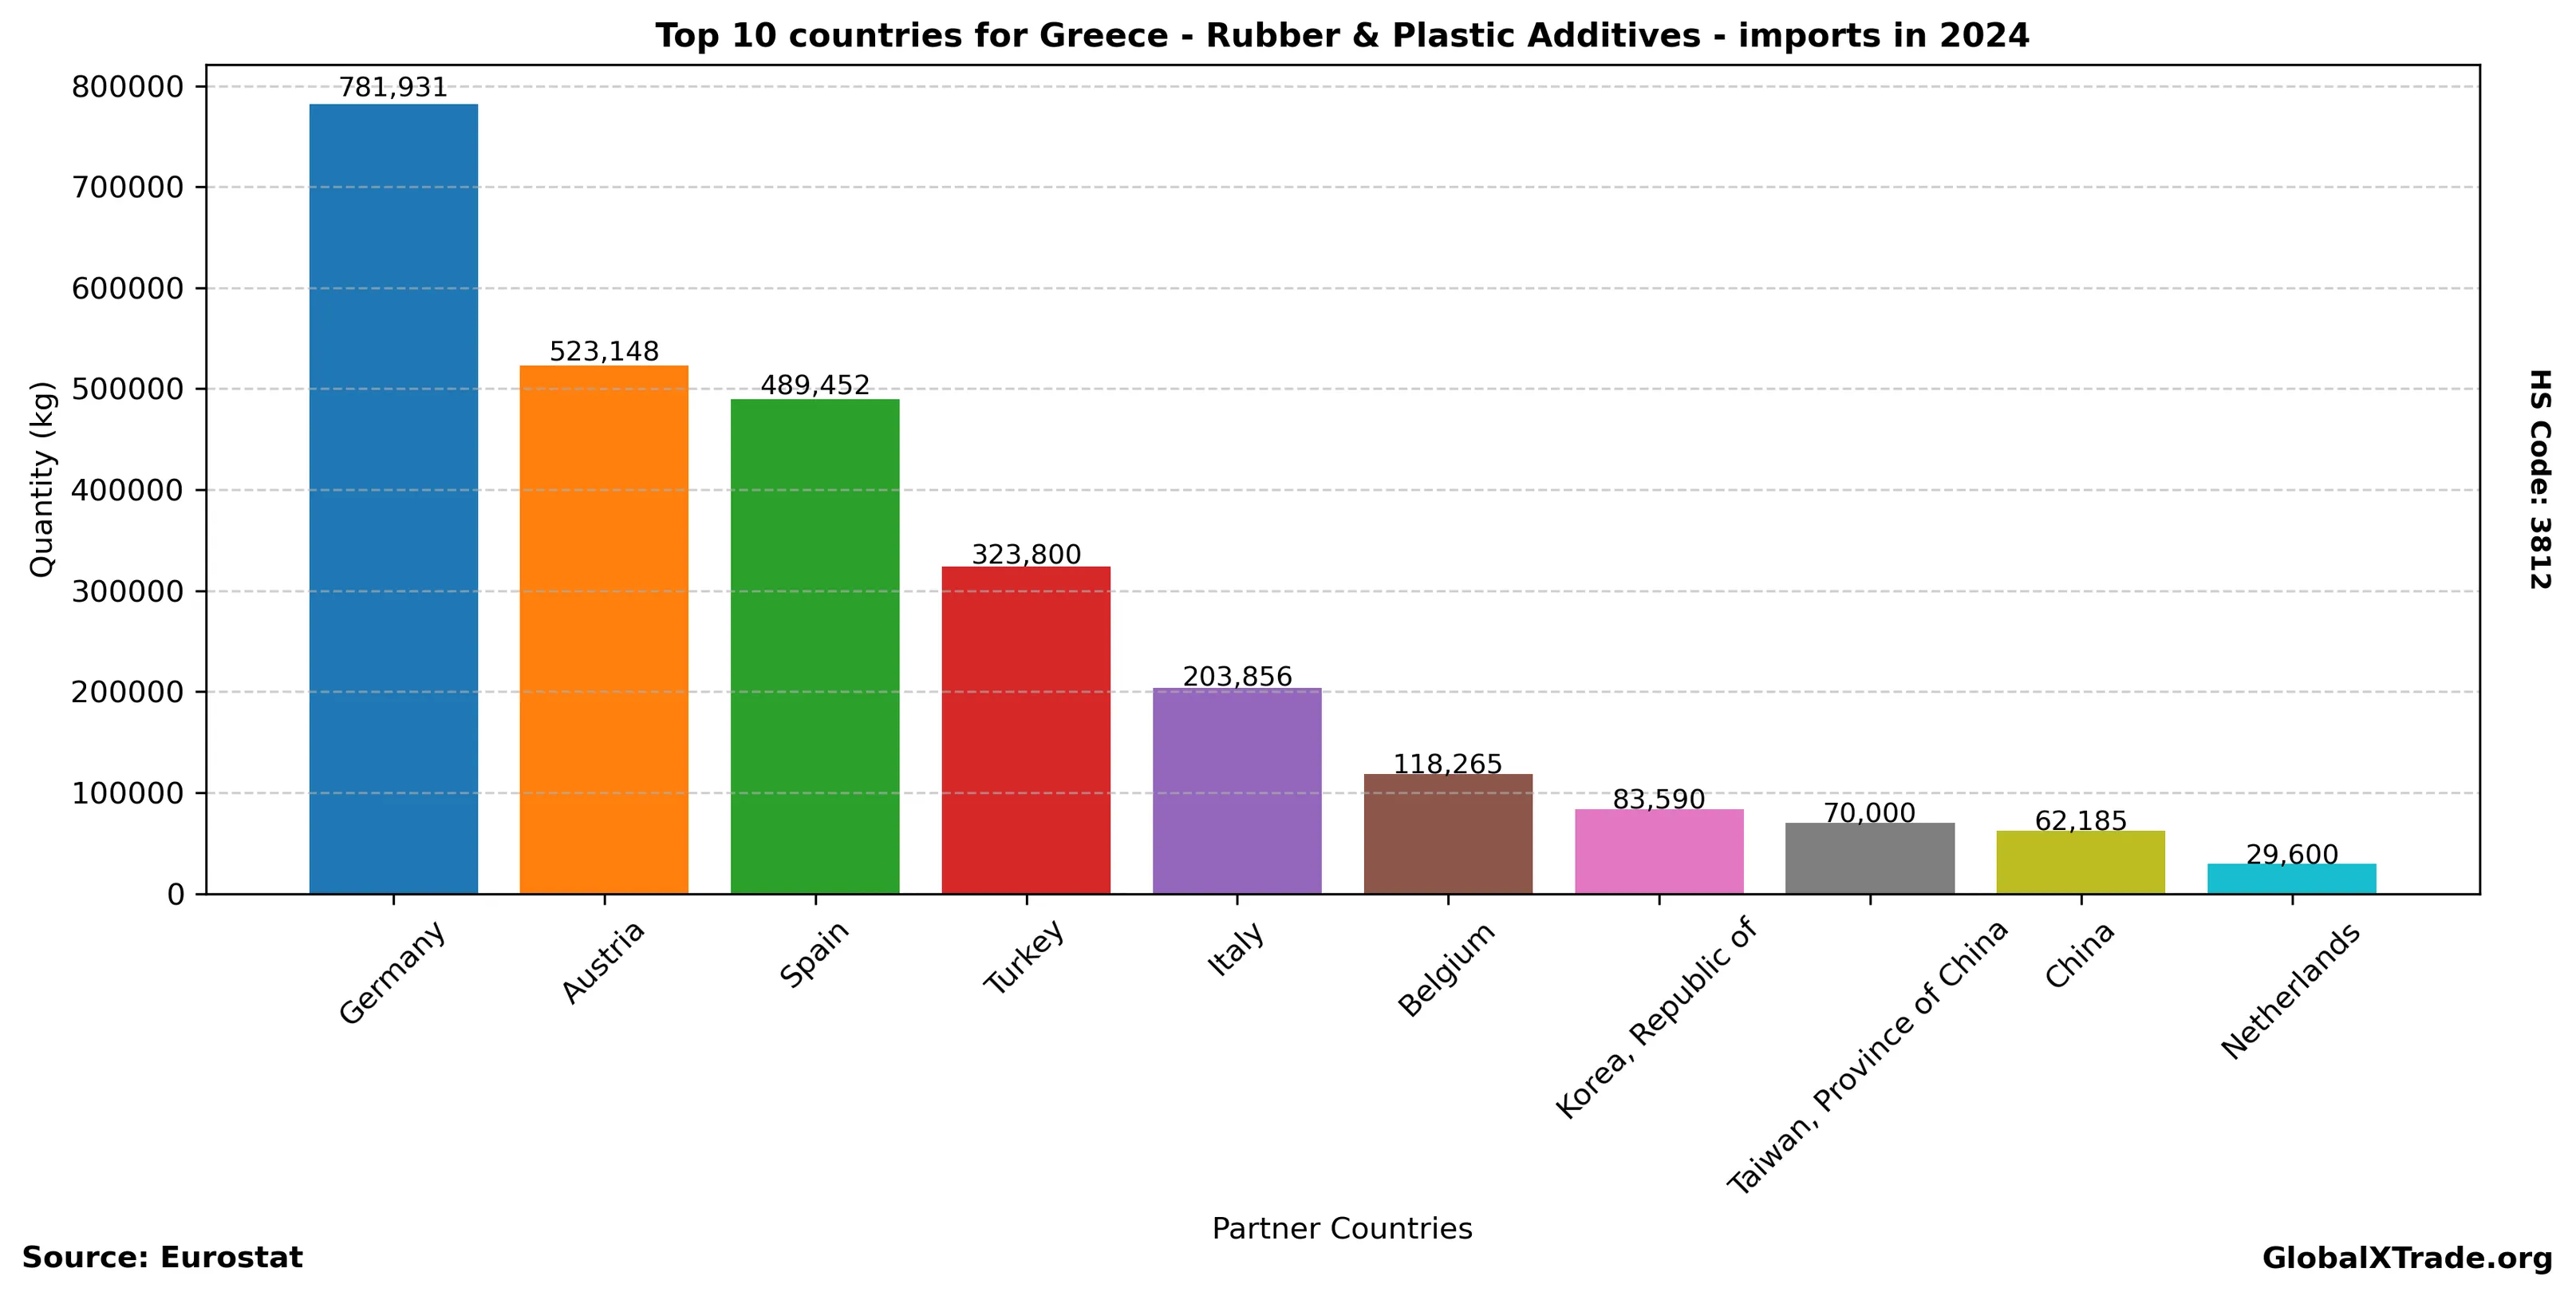
Top Partner Countries 2024
| partner | total_quantity_kg | total_value_eur |
|---|---|---|
| Germany | 781,931 | 7,765,287 |
| Austria | 523,148 | 1,245,800 |
| Spain | 489,452 | 1,481,967 |
| Turkey | 323,800 | 689,981 |
| Italy | 203,856 | 973,307 |
| Belgium | 118,265 | 598,154 |
| Korea, Republic of | 83,590 | 124,465 |
| Taiwan, Province of China | 70,000 | 316,986 |
| China | 62,185 | 156,790 |
| Netherlands | 29,600 | 154,090 |
Top Partner Countries 2023
| partner | total_quantity_kg | total_value_eur |
|---|---|---|
| Germany | 804,953 | 5,435,615 |
| Austria | 569,309 | 1,586,444 |
| Italy | 265,718 | 1,677,657 |
| Spain | 258,481 | 903,240 |
| Korea, Republic of | 229,710 | 326,025 |
| Bulgaria | 214,522 | 262,323 |
| Turkey | 185,908 | 470,953 |
| Belgium | 136,235 | 671,251 |
| Netherlands | 104,842 | 299,333 |
| China | 102,303 | 376,668 |