**Greek Imports of Tapioca Substitutes Rise Amid Soaring Demand**
**Greece Sees Increased Appetite for Alternative Starch Sources**
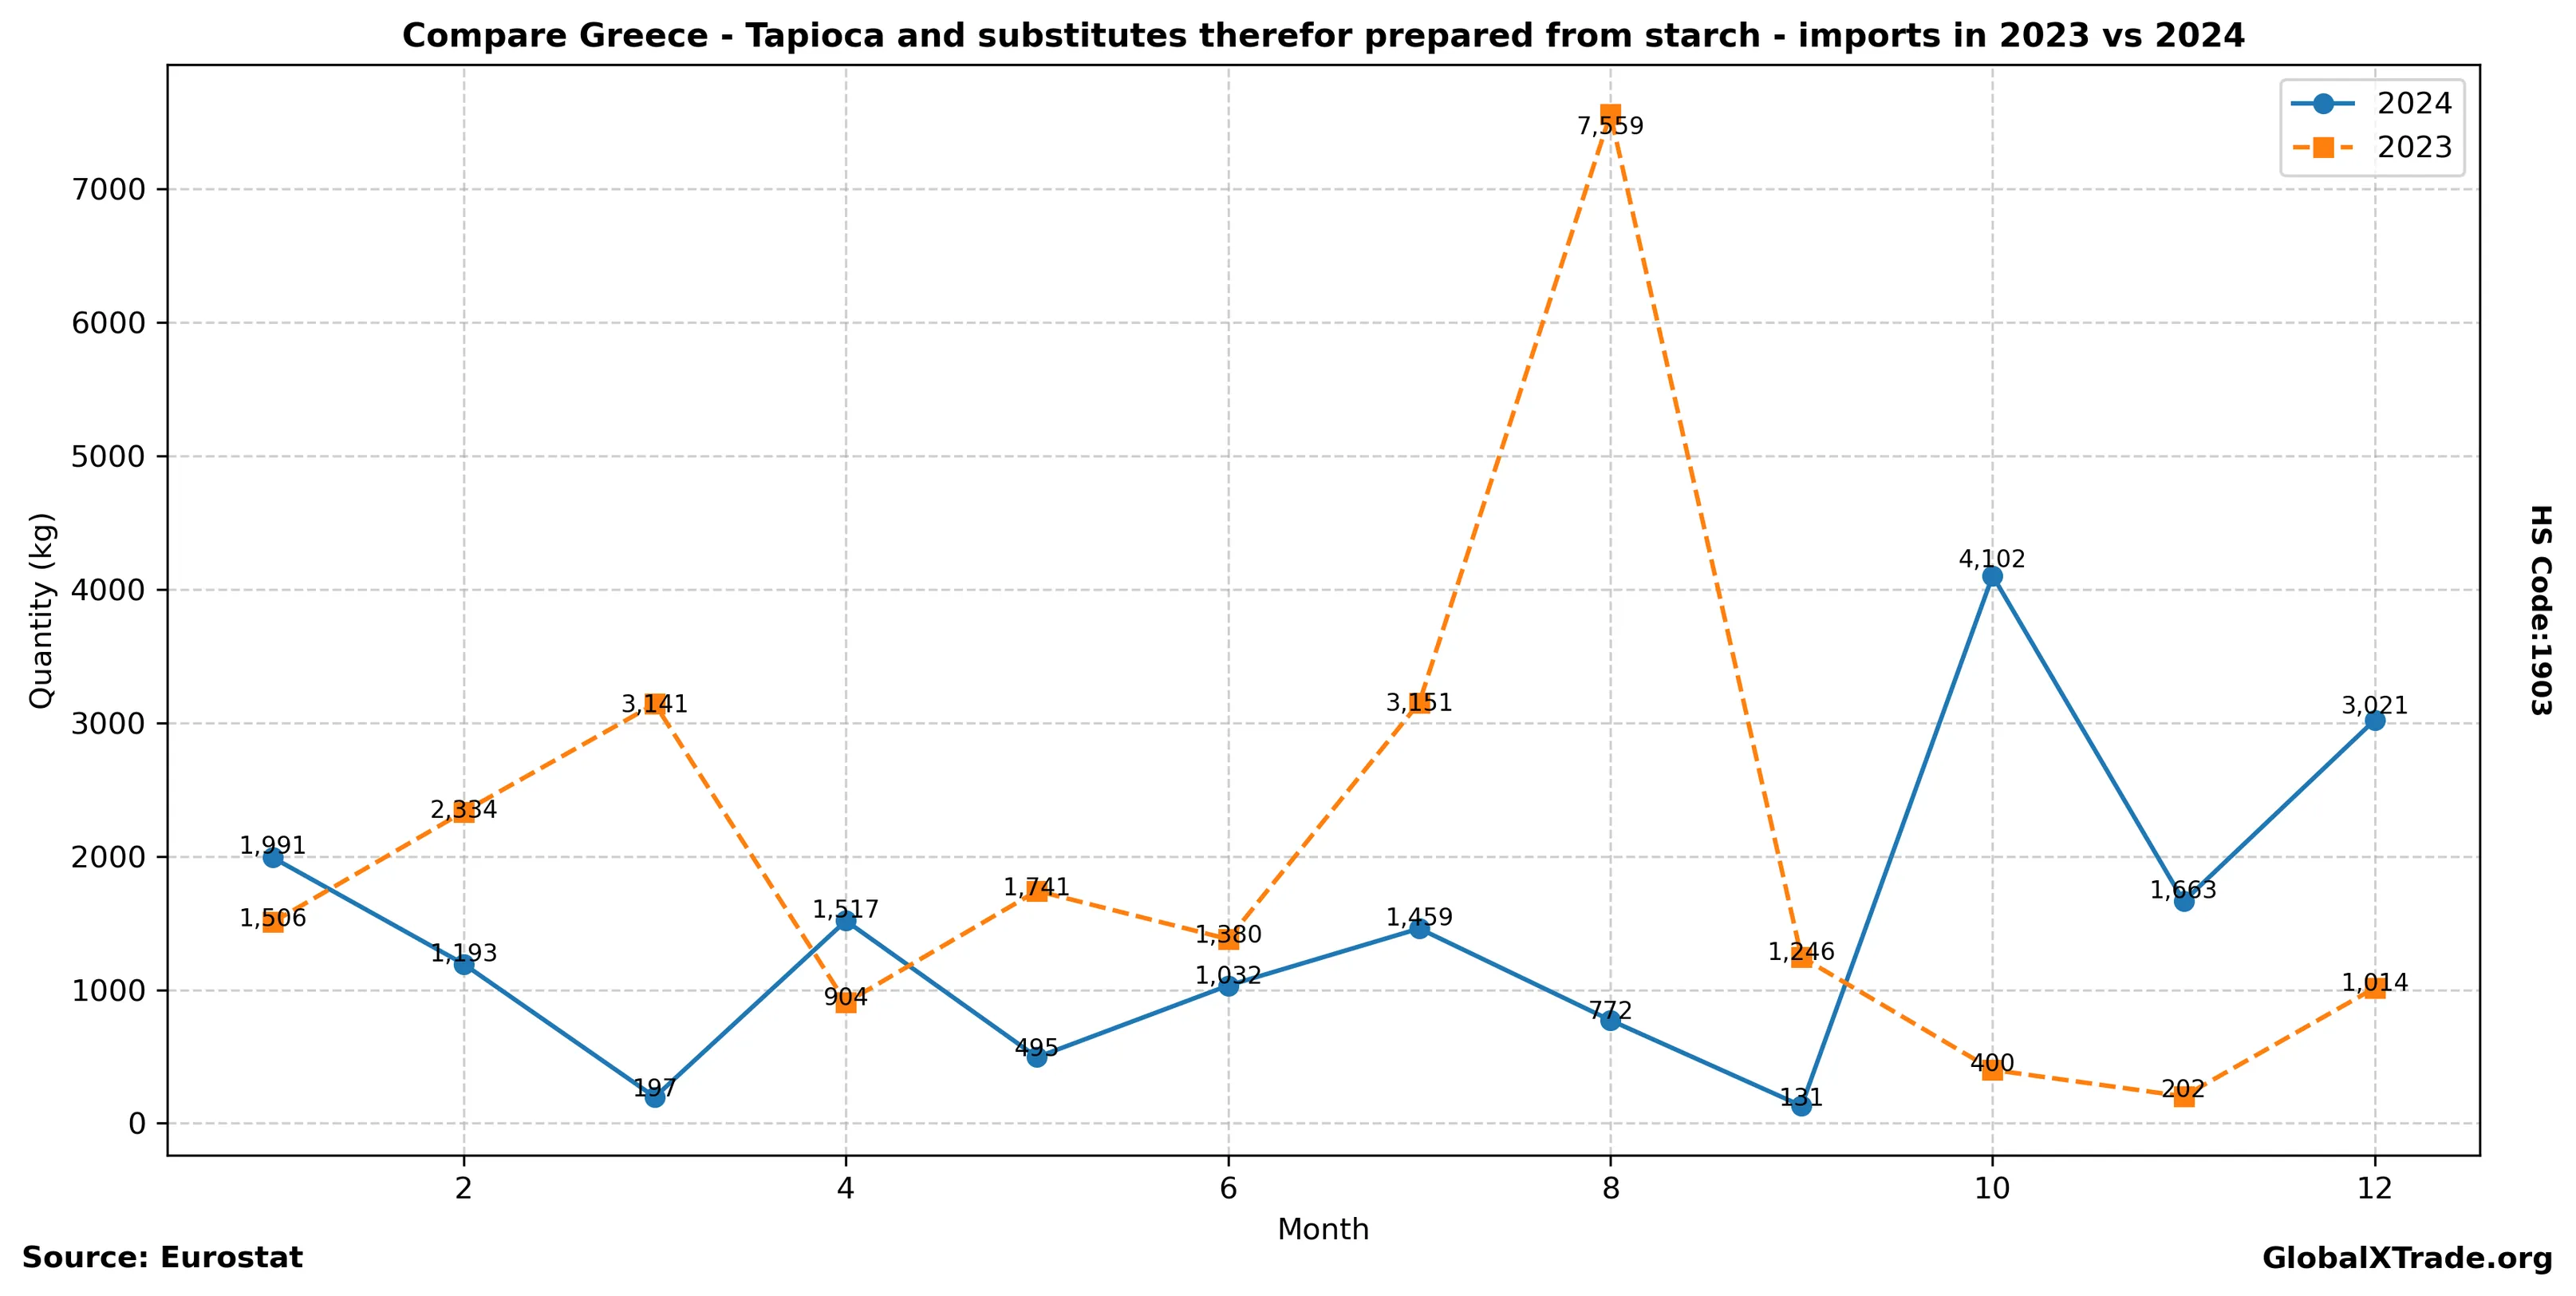
• Greek imports of tapioca substitutes rose 12.5% year-over-year in April, reaching 6,200 MT.
• The increase follows a sharp rise in demand from the food processing sector, driven by supply chain disruptions and high global wheat prices.
• Prices of tapioca substitutes remained steady at €1,400 per tonne, reflecting stable market conditions.
Greece’s imports of tapioca substitutes continued their upward trend in April, driven by increased demand from the country’s food processing industry. The sector has been seeking alternative starch sources due to supply chain disruptions and high global wheat prices, which have made traditional wheat-based products less competitive. As a result, Greek importers turned to tapioca substitutes as a viable alternative, leading to a 12.5% year-over-year increase in imports.
Yearly Import Summary
| year | total_quantity_kg | total_value_eur |
|---|---|---|
| 2020 | 7,379 | 24,918 |
| 2021 | 169,108 | 281,400 |
| 2022 | 141,845 | 314,318 |
| 2023 | 24,578 | 82,687 |
| 2024 | 17,573 | 64,346 |
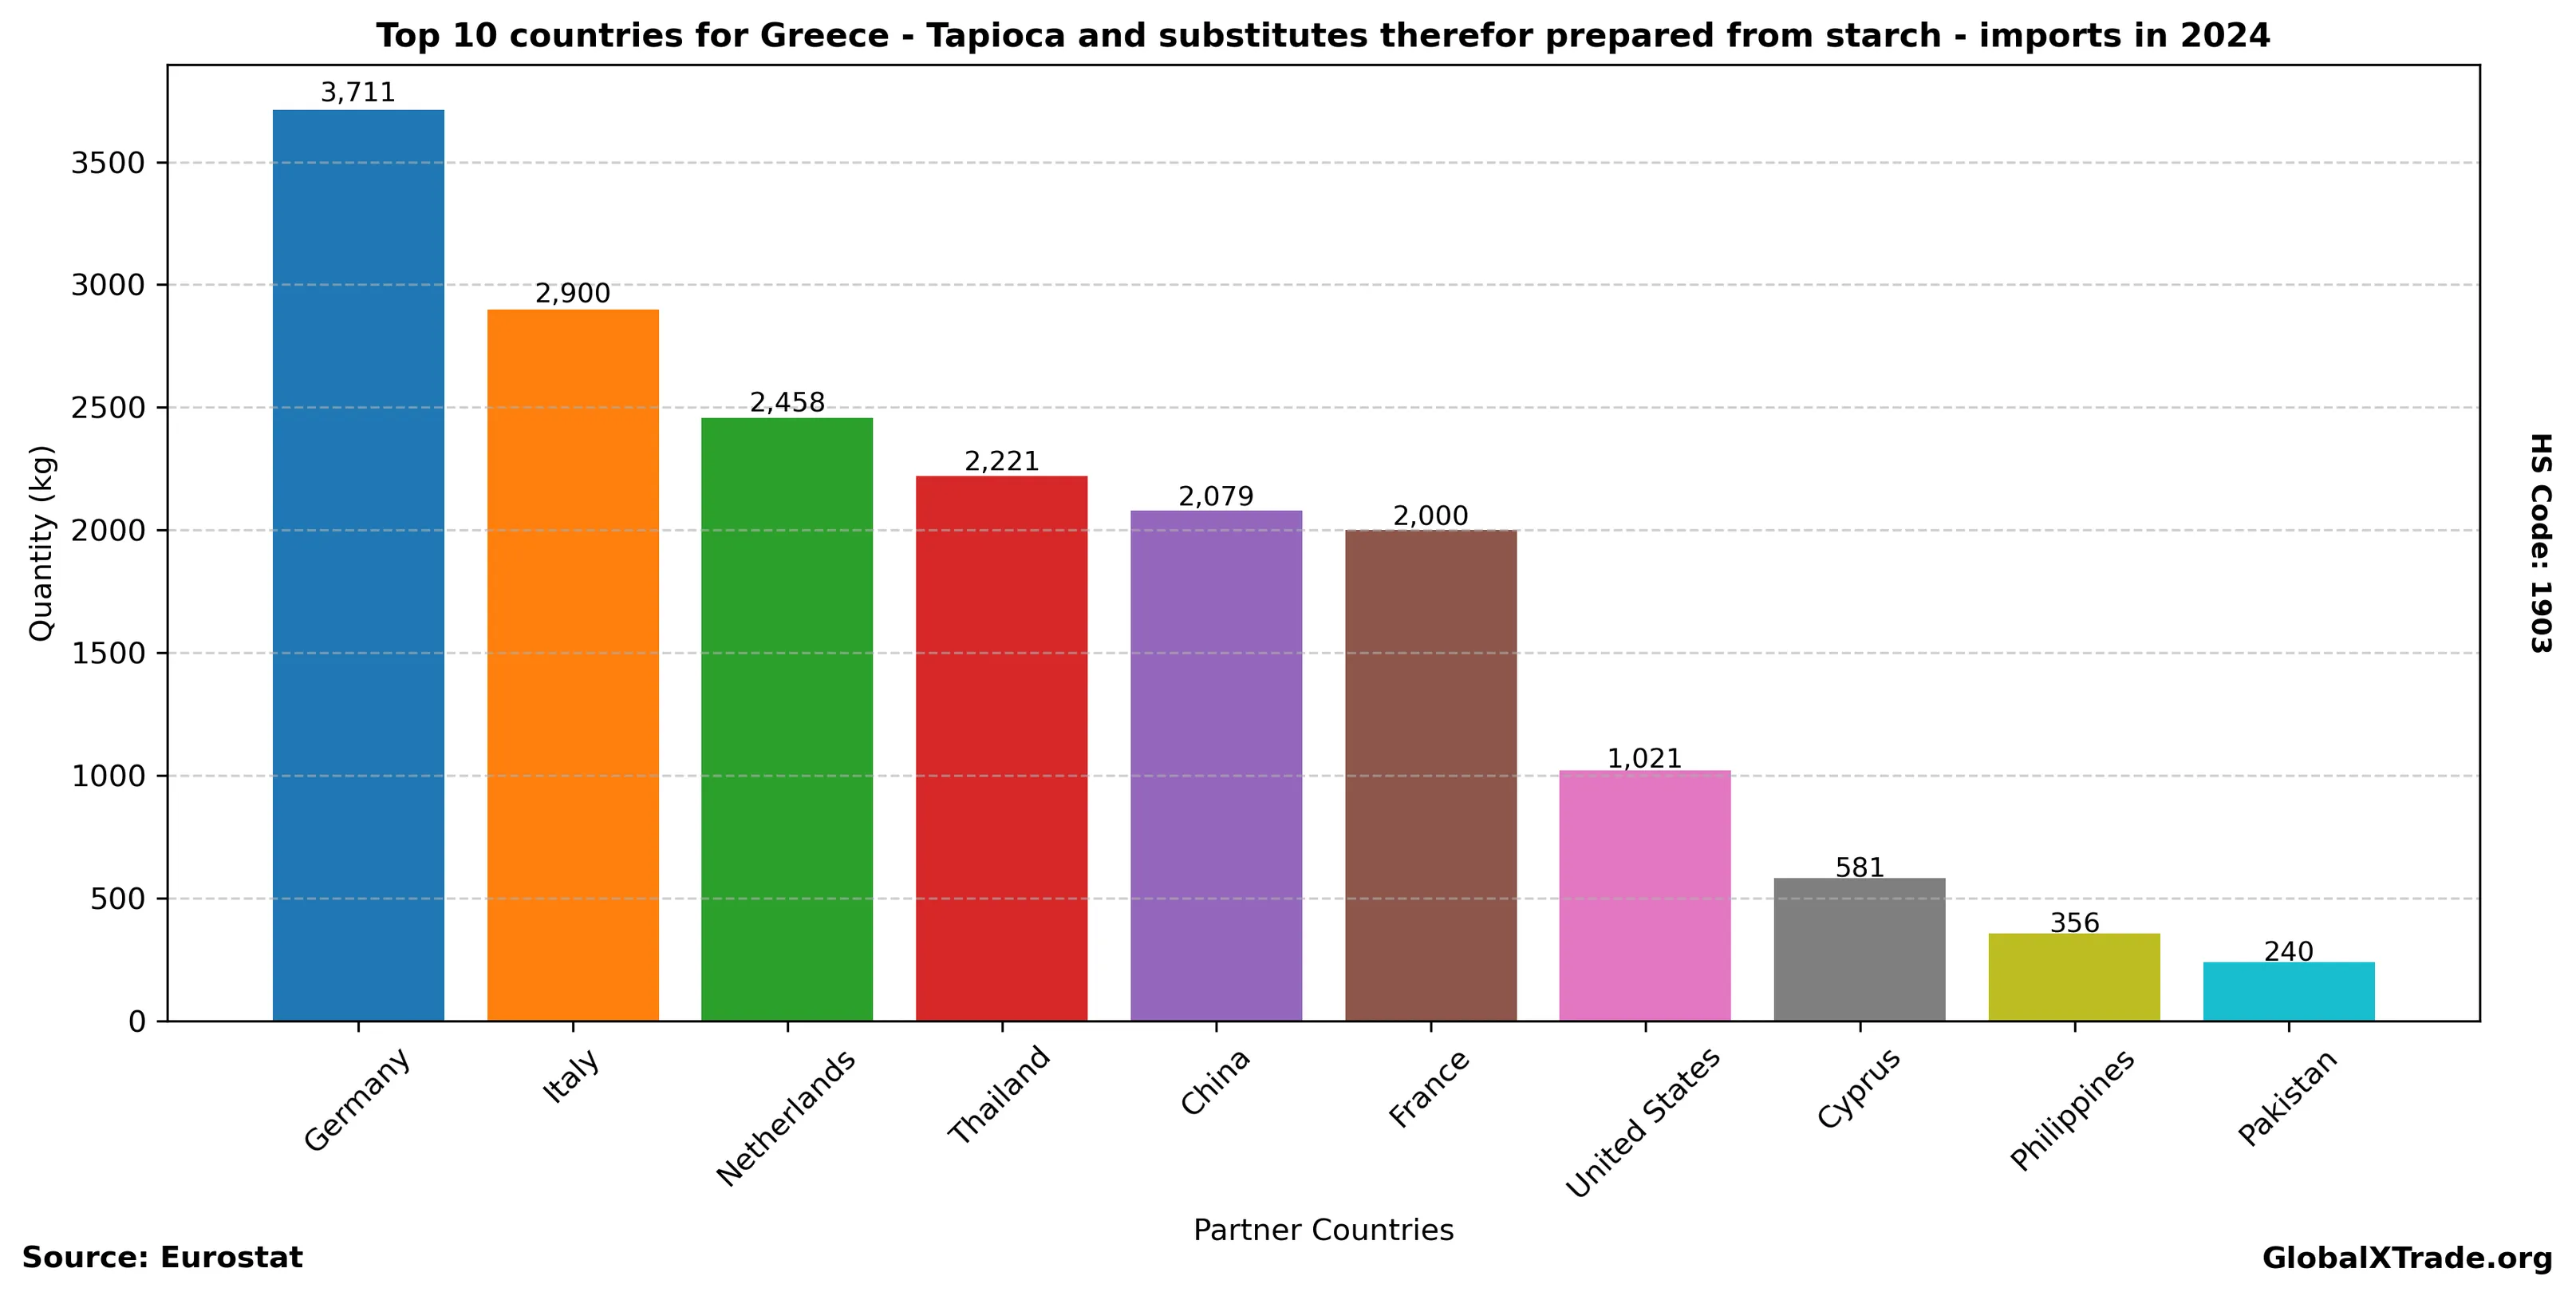
Top Partner Countries 2024
| partner | total_quantity_kg | total_value_eur |
|---|---|---|
| Germany | 3,711 | 13,951 |
| Italy | 2,900 | 5,967 |
| Netherlands | 2,458 | 8,550 |
| Thailand | 2,221 | 4,082 |
| China | 2,079 | 9,872 |
| France | 2,000 | 6,240 |
| United States | 1,021 | 11,904 |
| Cyprus | 581 | 1,564 |
| Philippines | 356 | 1,308 |
| Pakistan | 240 | 644 |
Top Partner Countries 2023
| partner | total_quantity_kg | total_value_eur |
|---|---|---|
| Thailand | 5,488 | 6,130 |
| Cyprus | 4,449 | 11,418 |
| Germany | 4,220 | 18,606 |
| France | 3,570 | 11,912 |
| Italy | 2,237 | 9,513 |
| China | 1,800 | 2,643 |
| United States | 1,125 | 13,860 |
| Denmark | 960 | 5,388 |
| Philippines | 406 | 1,093 |
| Netherlands | 323 | 2,124 |