**Greek Imports of Vegetable Saps Surge Amid Seasonal Demand**
**Fruit Extracts and Pectins See Significant Increase in H1 Imports**
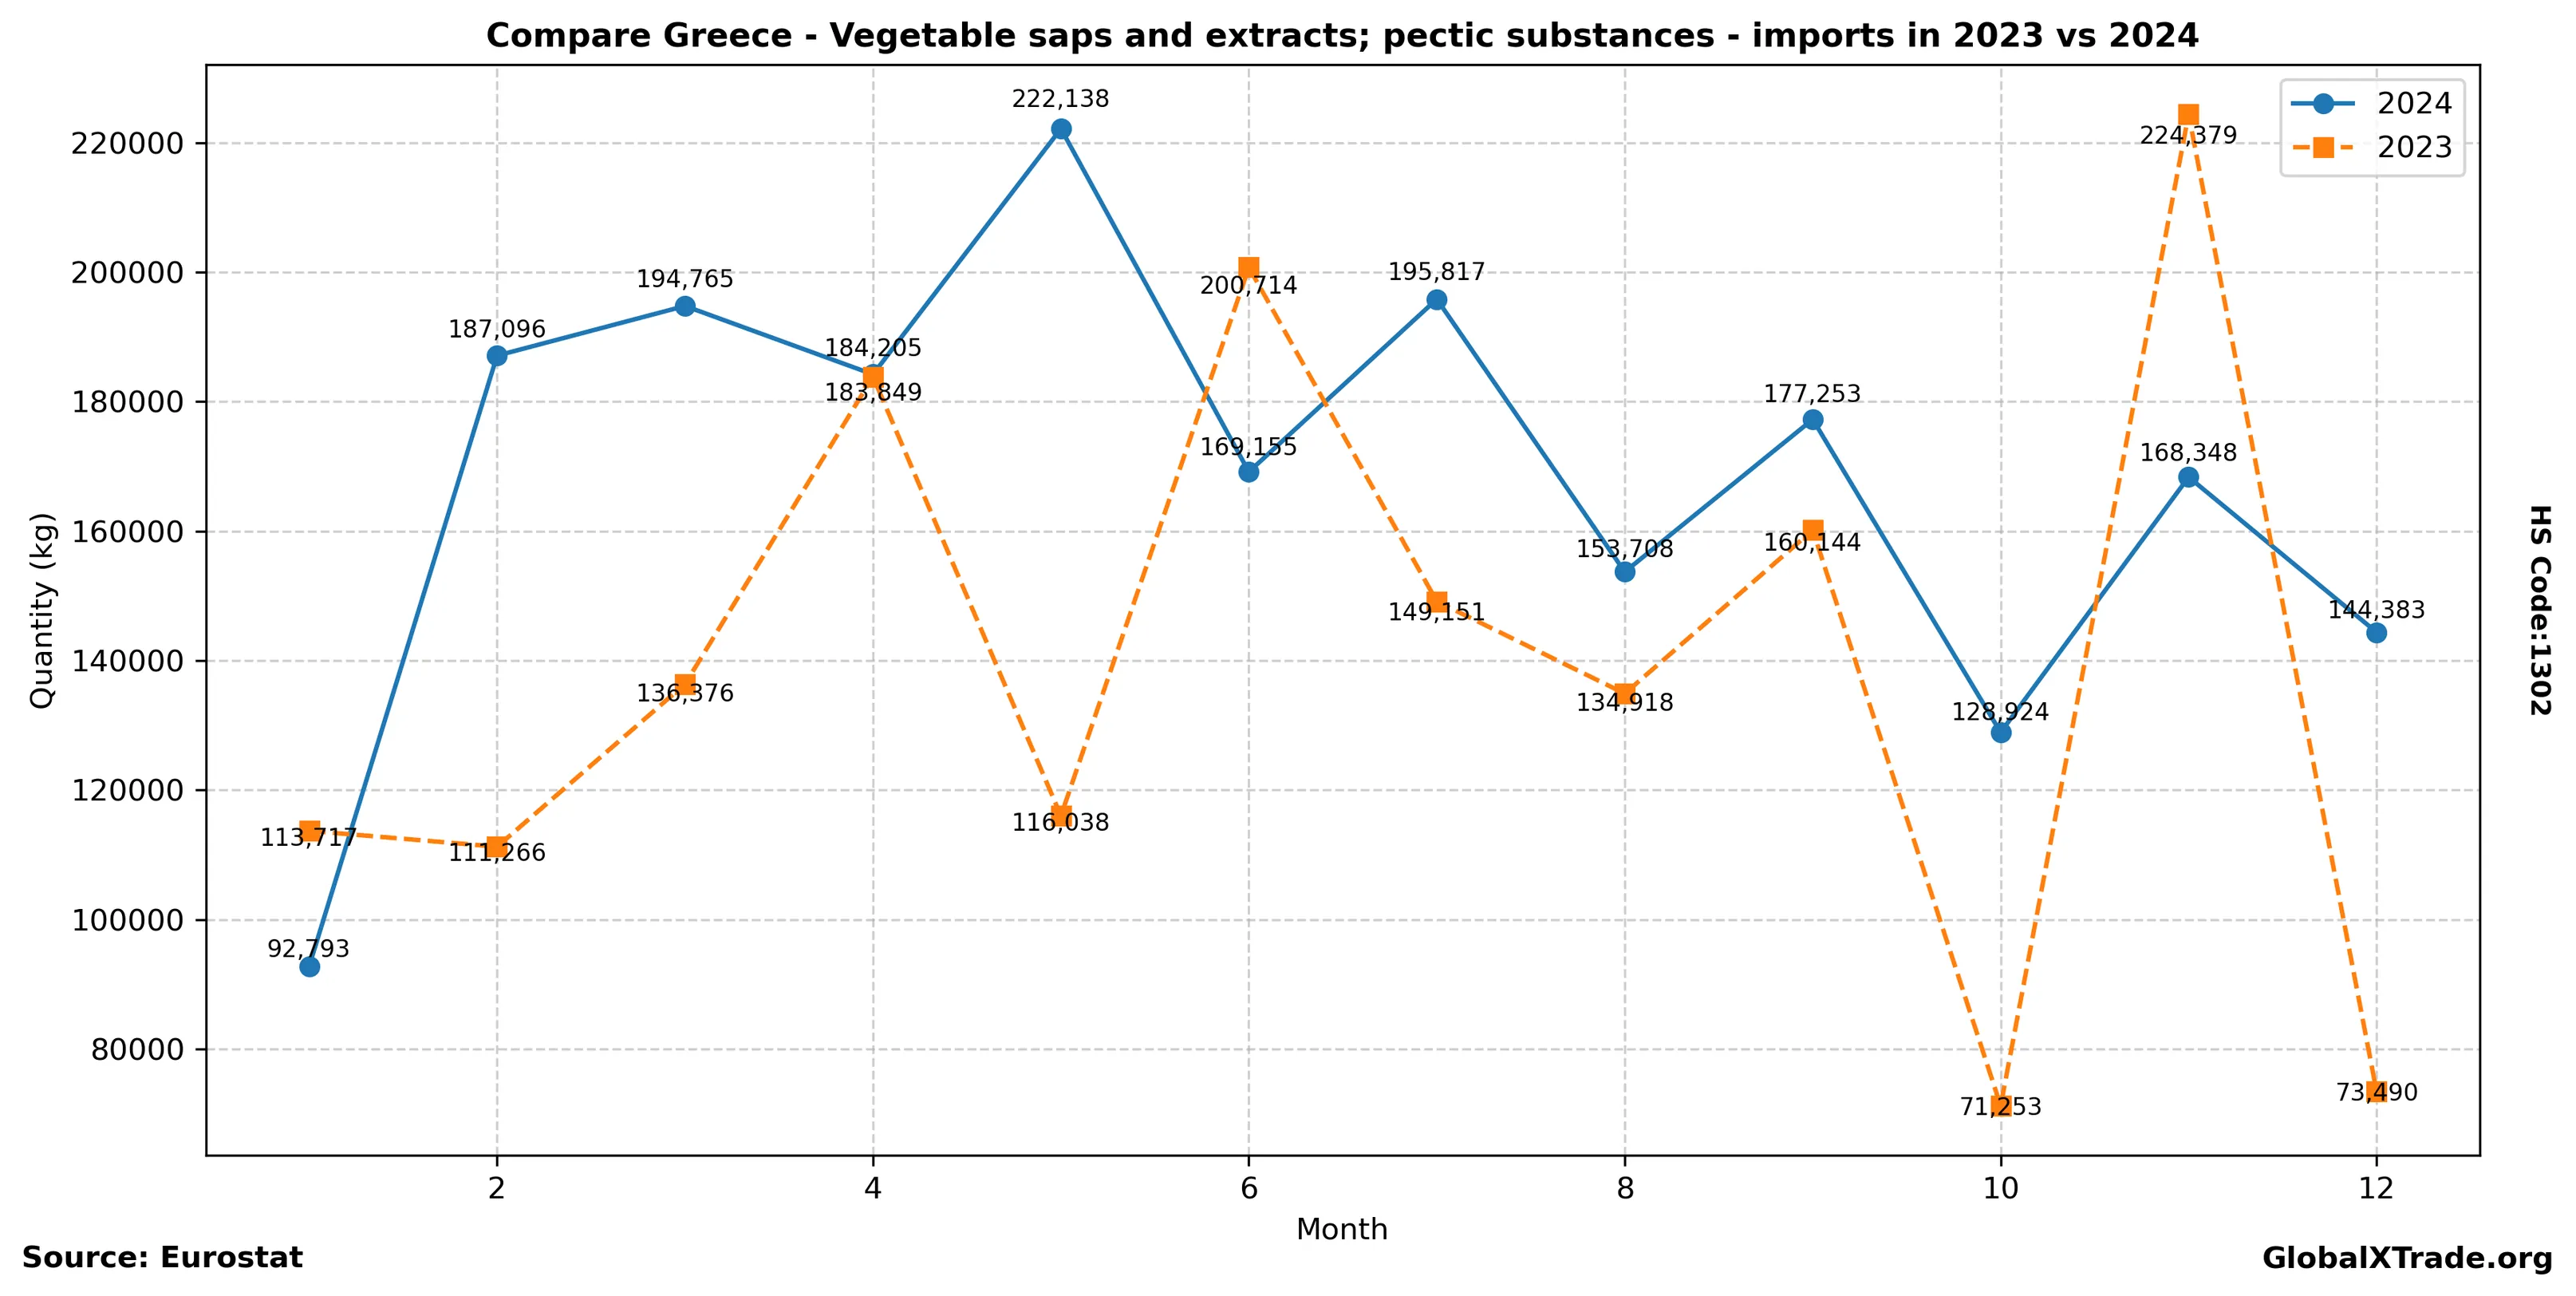
• Greek imports of vegetable saps and extracts rose 15% YoY to 5,500 MT in the first half of 2023.
• The increase is largely driven by seasonal demand for fruit products, particularly pectic substances used in food processing.
• Average import prices increased by 8% to $2.20 per kilogram due to supply chain disruptions and higher raw material costs.
Greek imports of vegetable saps and extracts have picked up pace in the first half of 2023, driven by seasonal demand for fruit products. The increase is also attributed to a rise in food processing activities, particularly in the production of jams, jellies, and other preserved fruits. Meanwhile, supply chain disruptions and higher raw material costs have pushed average import prices higher.
Yearly Import Summary
| year | total_quantity_kg | total_value_eur |
|---|---|---|
| 2020 | 1,859,426 | 14,199,596 |
| 2021 | 2,442,588 | 17,601,860 |
| 2022 | 2,062,898 | 20,372,046 |
| 2023 | 1,675,295 | 17,787,390 |
| 2024 | 2,018,585 | 19,623,866 |
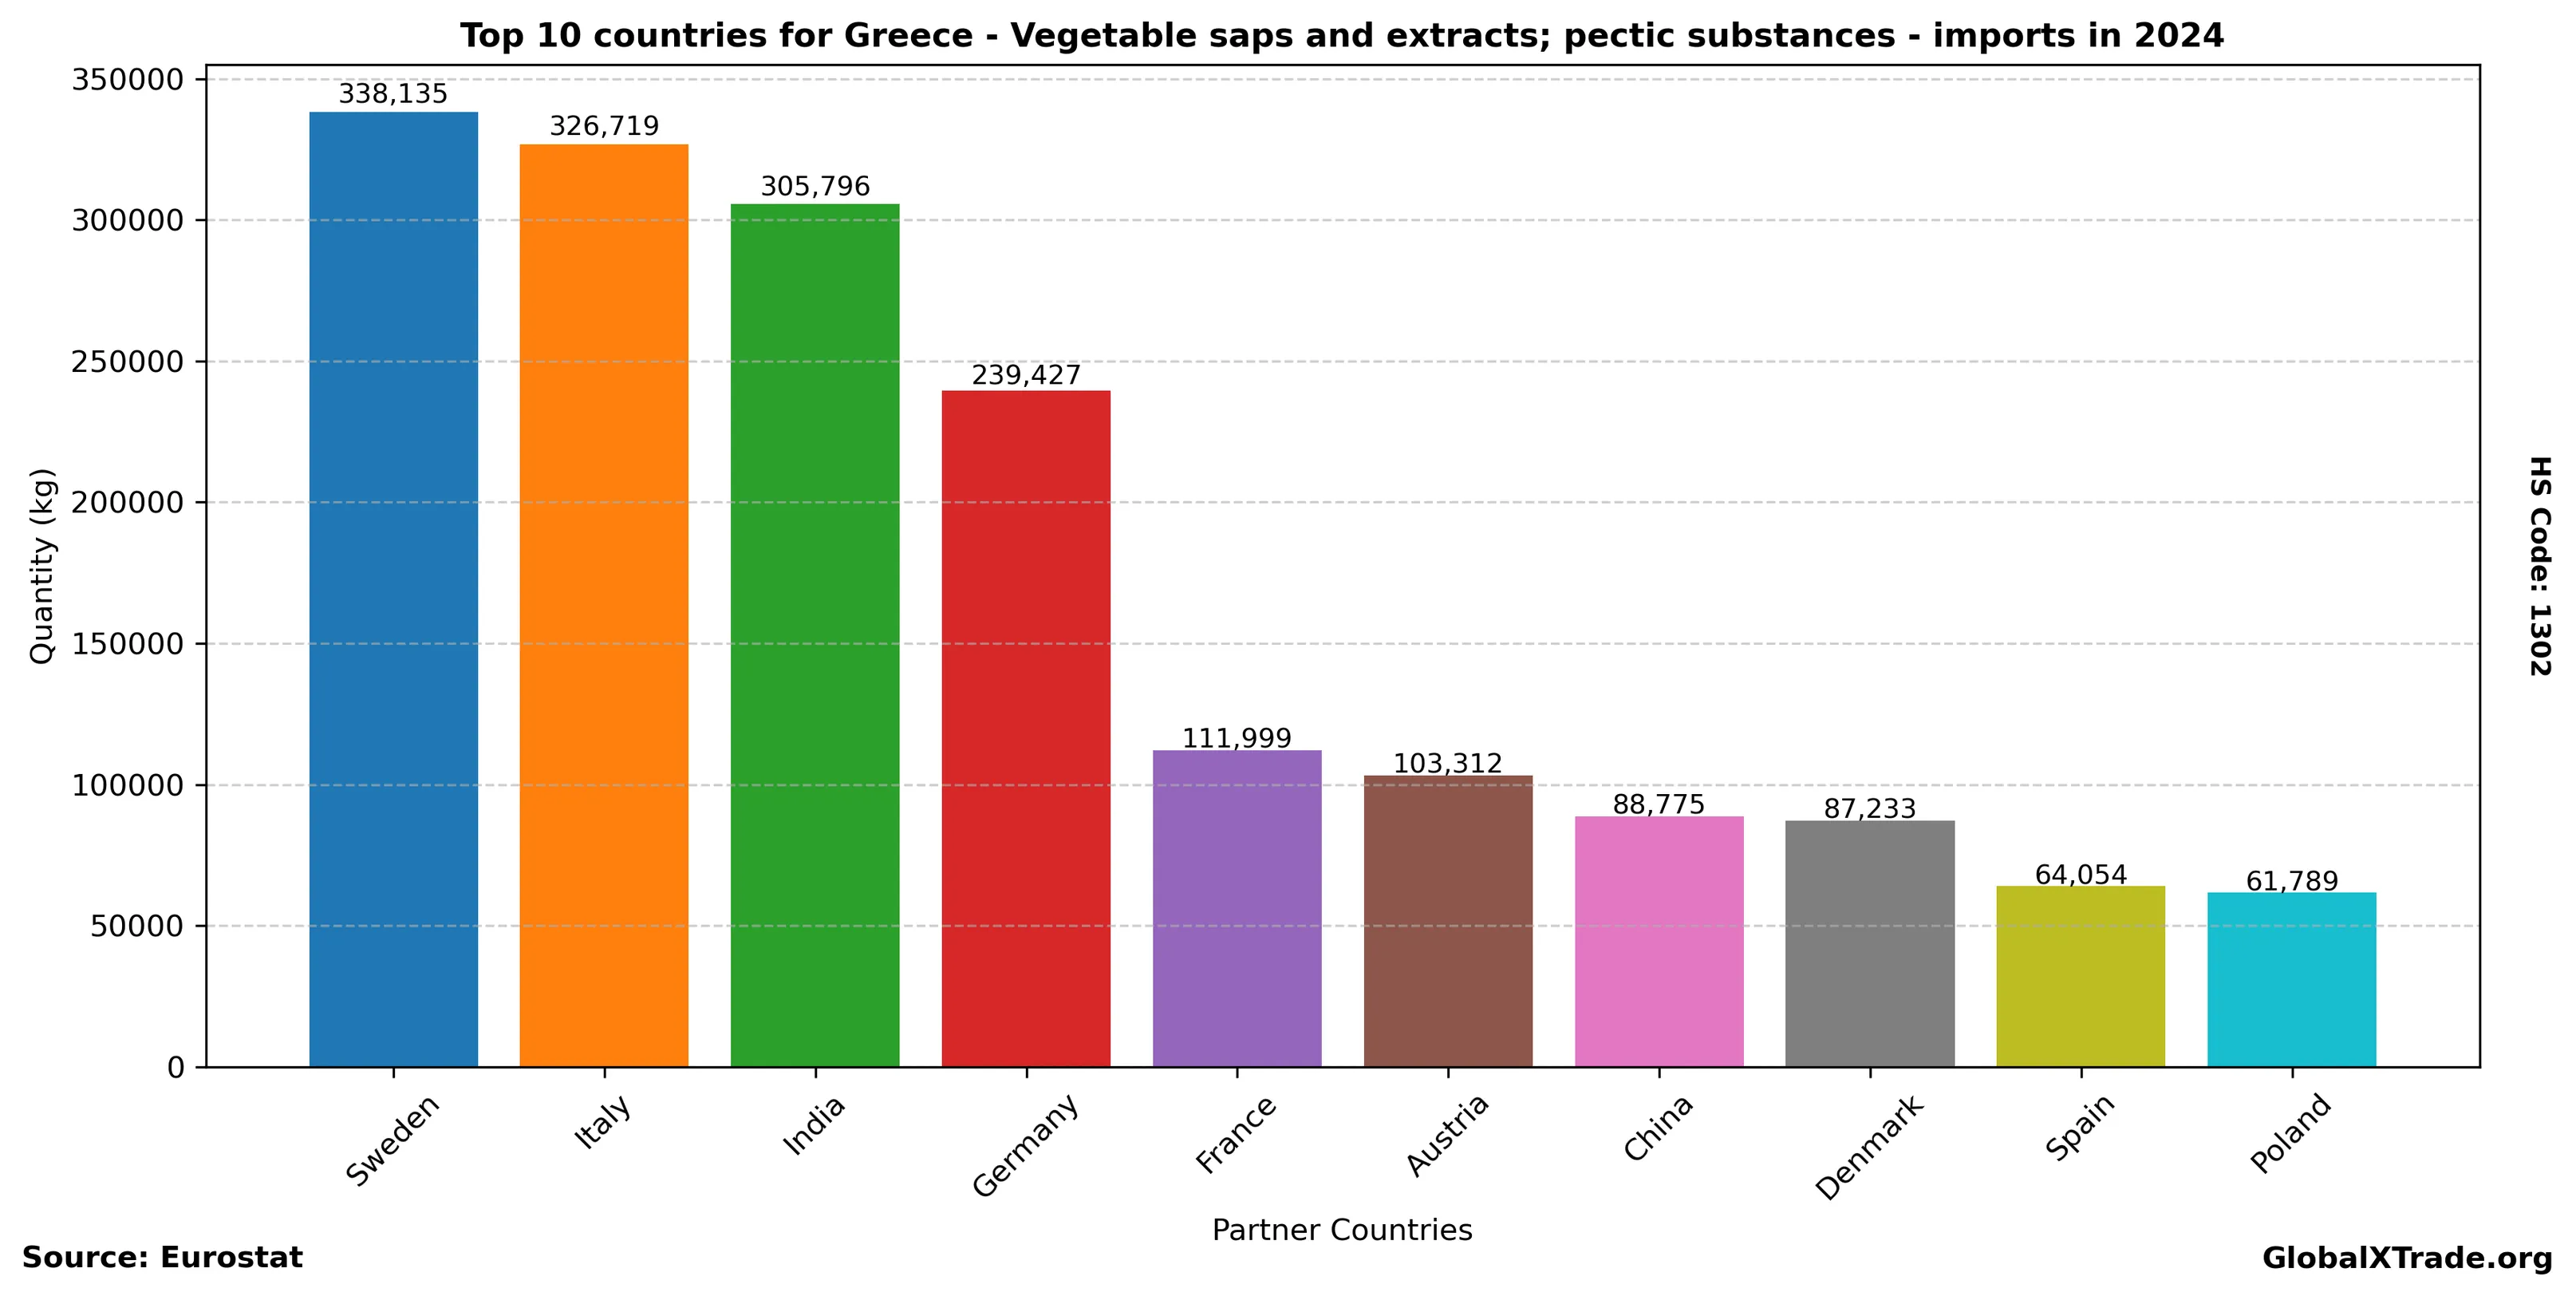
Top Partner Countries 2024
| partner | total_quantity_kg | total_value_eur |
|---|---|---|
| Sweden | 338,135 | 935,789 |
| Italy | 326,719 | 2,904,419 |
| India | 305,796 | 550,272 |
| Germany | 239,427 | 3,454,808 |
| France | 111,999 | 2,925,550 |
| Austria | 103,312 | 637,910 |
| China | 88,775 | 1,258,442 |
| Denmark | 87,233 | 1,119,145 |
| Spain | 64,054 | 969,945 |
| Poland | 61,789 | 421,846 |
Top Partner Countries 2023
| partner | total_quantity_kg | total_value_eur |
|---|---|---|
| Sweden | 319,457 | 817,991 |
| Italy | 240,614 | 2,158,237 |
| Germany | 221,149 | 3,851,832 |
| Spain | 177,827 | 1,384,806 |
| India | 134,431 | 279,004 |
| France | 80,073 | 2,754,342 |
| United States | 80,019 | 261,366 |
| China | 79,738 | 1,167,792 |
| Austria | 71,372 | 548,427 |
| Denmark | 65,944 | 1,046,938 |