
**Greek Bottled Water Imports Surge Amid Summer Demand**
**Bottled water shipments from EU countries increase as tourism season peaks**
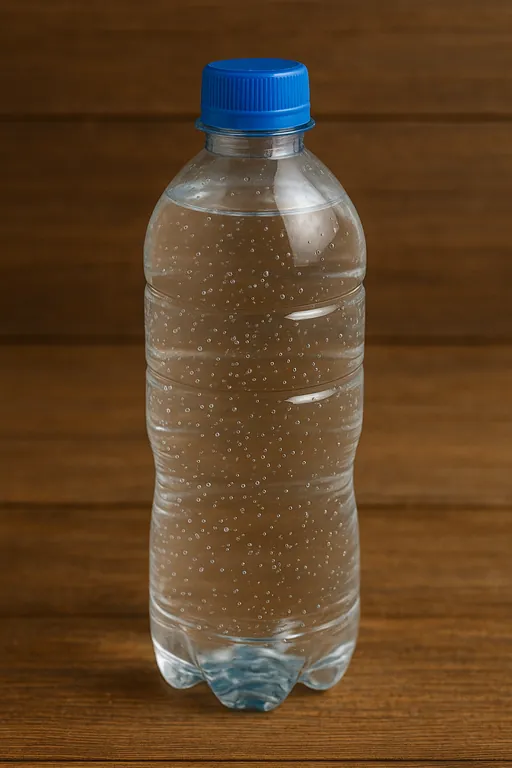
• Greek imports of bottled water rose by 12% year-on-year in June to reach 30,000 metric tons.
• The majority of these imports originated from Italy and Spain, with shipments driven by strong demand for mineral water during the peak summer tourist season.
• Average prices for imported bottled water remained steady at €0.45 per liter.
Greek bottled water imports continued their upward trend in June as tourism demand surged nationwide. Analysts point to increased visitor numbers and warmer weather as key drivers of this growth. As a result, bottling companies are expected to maintain high production levels throughout the remainder of the year, potentially leading to sustained import volumes.
Yearly Import Summary
| year | total_quantity_kg | total_value_eur |
|---|---|---|
| 2020 | 112,625,261 | 85,032,592 |
| 2021 | 133,896,648 | 104,578,393 |
| 2022 | 167,876,612 | 138,029,270 |
| 2023 | 150,997,965 | 146,799,241 |
| 2024 | 180,832,198 | 175,028,900 |
Top Partner Countries 2024
| partner | total_quantity_kg | total_value_eur |
|---|---|---|
| Romania | 66,800,604 | 31,576,113 |
| Hungary | 27,512,456 | 25,837,368 |
| Ireland | 18,038,923 | 25,616,041 |
| Austria | 13,807,859 | 28,266,238 |
| Italy | 10,660,838 | 11,703,245 |
| Belgium | 8,258,018 | 7,729,563 |
| Bulgaria | 7,118,692 | 5,580,746 |
| Germany | 6,509,299 | 9,239,862 |
| Netherlands | 3,437,366 | 5,240,710 |
| Denmark | 1,978,993 | 5,200,192 |
Top Partner Countries 2023
| partner | total_quantity_kg | total_value_eur |
|---|---|---|
| Romania | 52,768,175 | 27,017,111 |
| Hungary | 22,000,311 | 20,070,404 |
| Ireland | 15,047,474 | 18,414,390 |
| Austria | 12,701,938 | 26,341,842 |
| Belgium | 9,339,522 | 7,884,898 |
| Italy | 8,956,615 | 9,304,673 |
| Bulgaria | 6,533,658 | 5,829,319 |
| Germany | 6,265,815 | 8,131,237 |
| Netherlands | 2,495,816 | 3,268,430 |
| XS | 2,415,191 | 3,279,477 |

